Dear friends,
Dive into the exciting realm of ABCD pattern trading – a smart way to handle stocks. This method helps you spot specific shapes on charts, making it easier to handle market ups and downs. This guide will break down ABCD patterns, showing how these four-point shapes can open doors for smart stock trading.
I am here to guide you through this journey, sharing expert tips to help you understand and use ABCD patterns for successful trades. Let's learn together and boost your trading skills with confidence!
The article covers the following subjects:
What is the ABCD trading pattern?
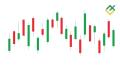
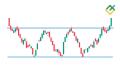
The ABCD pattern is like a roadmap for traders in the stock market. It's a four-step pattern that helps us predict price movements. First, there's an upward or downward trend (A), followed by a slight price reversal (B). Then, the price continues in the original direction (C) before reaching a point where the pattern completes (D). This pattern is a valuable tool because it shows us potential entry and exit points for trades. Following the ABCD's three consecutive price swings, traders can decide when to buy or sell stocks.
![]()
What Makes the ABCD Trading Pattern Significant?
Firstly, it gives structure to the chaos of the financial market. The pattern is like a language that stocks speak, and once you understand it, you can anticipate their moves. It's not about luck; it's about recognizing the signals.
Secondly, the ABCD pattern provides precise entry and exit points. For traders, timing is everything, and this pattern is a guidebook on when to jump in and when to step back. It's all about making informed decisions.
In a nutshell, understanding the ABCD pattern is like having a superpower in trading. It empowers you to make smarter moves, turning the unpredictable stock market into a terrain you can navigate confidently.
Get access to a demo account on an easy-to-use Forex platform without registration
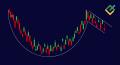
How to Draw an ABCD Trading Pattern
Drawing an ABCD pattern is more straightforward than it sounds and a valuable skill for anyone in the stock market game. Here's a step-by-step guide to help you master it.
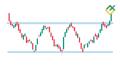
- Identify Points A, B, C, and D. Locate these four critical points on your stock chart. A represents the starting point, B marks the first significant price increase, C is the retracement from B, and D signifies the potential reversal point.
- Use Trend Lines. Connect points A to B, and then draw a line from C to D. This forms the distinctive shape of the ABCD pattern. These trend lines help visualize the price movements and identify potential trading opportunities.
- Measure Price Movements. Gauge the price distances between each point. This step is crucial for understanding the pattern's structure and anticipating potential profits.
- Confirm with Fibonacci Retracement. To strengthen your analysis, apply Fibonacci retracement tools and levels to validate the ABCD pattern. This tool helps assess potential reversal zones and adds a layer of confirmation to your trading strategy.
Practice on a Demo Account. Before diving into live trading, hone your skills on a demo account. This allows you to refine your ability to spot ABCD patterns without risking real money.
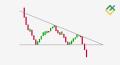
![]()
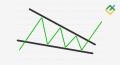
AB=CD Harmonic Pattern on Bitcoin example
Let’s study AB=CD pattern.
Unlike other patterns of harmonic analysis, AB=CD has four-point structure.
The picture below shows a perfect AB=CD pattern (bearish pattern):
![]()
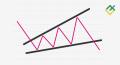
First of all, the pattern-like structure can be the base of any harmonic pattern (Gartley, Butterfly, Bat, Shark).
So, it is important to identify AB=CD before you start looking for any above mentioned harmonic patterns in the chart.
It’s quite simple to do, as AB=CD has a unique feature, allowing to recognize it.
The feature results from the pattern name, swing leg AB is equal to swing leg CD
Besides, the identifying point is point(C).
To confirm ABCD pattern, it must be at one of the following Fibonacci levels of AB leg projection (left column). It should be noted, that when the point gets to the level, one can identify the extreme point, which will close the pattern (D) (left column), where point (D) will be at the levels:
Point (C) of AB | Point (D) of CB |
0.382 | 2.24 or 2.618 |
0.5 | 2 |
0.618 | 1.618 |
0.707 | 1.41 |
0.786 | 1.27 |
0.886 | 1.13 |
To illustrate this, there is an example in the picture below, where point (C) gets to level 0.618 of AB projection, and (D) – to level 1.618 of CB projection.
![]()
It is necessary to emphasize here, that there is an alternative model of AB=CD pattern, which later, as a rule, becomes a part of Crab or Butterfly patterns (strong reversal patterns).
Correct proportions for this chart are CD = AB; 1.27AB; 1.618AB.
ABCD pattern trading
Let’s study two variants:
1. When point (C) is identified
![]()
To illustrate, let’s take the example of this pattern for BTCUSD.
Point (C) is at 0.799 of AB projection.
This point doesn't get to the levels from the table but is close to 0.786
(unfortunately, due to high volatility, I have to let some deviations)
Point (C) of AB | Point (D) of CB |
0.382 | 2.24 or 2.618 |
0.5 | 2 |
0.618 | 1.618 |
0.707 | 1.41 |
0.786 | 1.27 |
0.886 | 1.13 |
Based on the table above, with slight deviations, we can open a buy position with the target point (TP 2) at point (D) level -1.27 of CB leg.
Besides, we can also mark SLZ (stop loss zone), PPZ (profit protection zone) and TP (target points).
SLZ should be lower than point (A).
PPZ 1 – at level 0.382 of CB.
PPZ 2 – at level 0.618 of CB.
TP 1 – at point (B)level.
TP 2 – at level 1.27 of CB.
In the end, as we see in the chart below, bitcoin quote passed all the marked points but didn't reach TP2.
![]()
After point (D), we see a reversal black candlestick in the chart, indicating that the pattern has formed PRZ (price reversal zone), that confirms, that point (D) is in the correct place and we can close buy order.
2. When point (D) is identified (D)
Then, there is a variant, when point (D) is found.
As we study AB=CD bearish pattern, it will reasonable to expect retracement after the reversal point, PRZ.
![]()
However, in such super-bullish market, as the cryptocurrency one, I wouldn't recommend beginners to open short positions at all, for educational purpose, I must describe this trading strategy as well.
In this case, our key points will be as follows:
SELL – at the level intersection with point (B).
SLZ – above (D) point level.
PPZ1 – at level 0.382 of CD.
PPZ2 – at level 0.618 of CD.
TP1 – at point (C) level.
TP2 – at point (A) level.
As we see in the chart above, of all the targets we marked, only point PPZ1 worked out.
But even in such case we can not only avoid losses, but even make some profits.
Time zones will help us (they work for the first variant too).
As I have already said in my previous training article, time zones mark the period of time, when a key point should be found.
In our case, it is the end of correction
It is built from the time of the last leg in the zone from 1.38CD up to 2.681CD.
![]()
As we see in the picture, having covered more than a half of the marked zone, the price didn't get above level PPZ1, which is the signal to revise the targets and close short positions.
I want to emphasize, that the use of only harmonic patterns alone without additional confirming indicators involves high risks.
However, as this pattern works in any timeframe, it will be a good additional tool to your trading strategy.
What Are The Common Mistakes in ABCD Pattern Trading?
Traders often encounter pitfalls when navigating ABCD pattern trading. Here's a quick rundown of common mistakes to avoid:
- Ignoring Overall Market Trend. Failing to consider the broader market trend can lead to misjudging the ABCD pattern's significance.
- Overlooking Confirmation Signals. Relying solely on the pattern without confirming signals increases the risk of false trades.
- Neglecting Risk Management: Inadequate risk management, such as setting stop-loss orders, may expose traders to substantial losses.
- Impulsive Trading. Acting hastily without thorough analysis can result in poor decision-making and missed opportunities.
- Disregarding Timeframes. Not adjusting strategies to different timeframes may lead to inaccurate predictions.
By clarifying these common missteps, traders can enhance their ABCD stock pattern proficiency and make more informed investment decisions.
Conclusion
The ABCD pattern is a valuable tool in traders' arsenal, offering a structured approach to deciphering price movements in the stock market. By identifying distinct points — A, B, C, and D — investors gain insights into potential trend reversals or continuations. The simplicity of this pattern lends itself to various trading strategies, allowing both novice and seasoned traders to incorporate it into their decision-making processes.
However, success in ABCD patterns requires a nuanced understanding and diligent risk management. Traders should be cautious of common pitfalls, such as neglecting market trends, overlooking confirmation signals, and impulsive decision-making. With a keen eye for detail and a strategic approach, the AB CD pattern becomes a powerful ally in navigating the complexities of the financial markets.
As traders refine their skills and adapt to market dynamics, the ABCD pattern remains a fundamental tool for spotting opportunities and making robust trading decisions, contributing to a more comprehensive and effective trading strategy.
Platform where traders earn more

Trade on LiteFinance’s high-tech ECN platform and open an account so that beginner traders can copy you. Earn a commission for copy trading and boost your income.
ABCD Pattern FAQs
The ABCD pattern can be either bullish or bearish. It indicates potential trend reversals or continuations, offering traders insights into market movements.
A bullish ABCD harmonic pattern signifies a potential upward trend. It forms as the price moves from point A to B, retraces from B to C, and then continues upward from C to D.
Traders use the ABCD patterns by identifying points A, B, C, and D in a price chart. Entry and exit points are often based on the completion of these pattern formations.
In a downtrend, the ABCD forex pattern follows a similar structure but in reverse. It indicates potential reversals or continuations in a downward market trend.
Price chart of BTCUSD in real time mode
The content of this article reflects the author’s opinion and does not necessarily reflect the official position of LiteFinance broker. The material published on this page is provided for informational purposes only and should not be considered as the provision of investment advice for the purposes of Directive 2014/65/EU.
According to copyright law, this article is considered intellectual property, which includes a prohibition on copying and distributing it without consent.