One of the essential things in successful trading is the ability to identify the key support and resistance levels and determine the pivotal points where the overall trend is likely to reverse. A good way to calculate important psychological levels is the Pivot Points indicator. Depending on the method of plotting pivot points specified in the settings, the indicator automatically draws several support and resistance levels at High (Max), Low (Min), and Close prices. Read on, and you will learn the pivot point levels definition, Pivot Points indicator, the principle of plotting pivot points, and the trading systems based on the Pivot Points indicator.
The article covers the following subjects:
- What are pivot points?
- Types of Pivot Points
- Using pivot points in Forex trading
- How to add the Pivot Points indicator to MT4?
- How to use the Pivot Points on the LiteFinance platform?
- Pivot point trading strategies
- Pivot point formula — how to calculate the indicator
- What Do Pivot Points Tell You?
- Pivot Points: pros and cons
- Support & Resistance Levels
- Pivot points key takeaways
- Pivot Point trading: summary
- Pivot Points FAQ
What are pivot points?
What is a pivot point? First, let us define pivot point levels. Pivot is a French borrowing that slowly evolved grammatically in English, which literary means “a turn.” Pivot points are the reversal points or levels where the price rebounds and starts moving in the opposite direction. Differently put, Pivot is the level where the bullish trend will turn bearish and vice versa.
The indicator will be of use for Forex traders who:
Determines entry and exit points according to the support and resistance levels.
Chooses the method to calculate the length of stop loss and take profit.
Uses trading strategies within a trading range.
The principles of drawing Forex pivot points levels according to highs and lows are subjective. However, if you use horizontal levels built according to a specific mathematical formula, you will get a tool with a clear-cut interpretation. These are Pivot lines.
Types of Pivot Points
The classic formula for plotting stock pivot points involves using pivot points trading strategy based on the average of three types of prices — candlestick highs, lows, and closing prices. The difference between other pivot point formulas and the classic one is in the number of lines drawn, the use of additional correction factors, weighting factors.
1. Classic pivot point calculation formula: you need to calculate pivot points’ six horizontal lines: three resistance levels (R1-R3) and three pivot support levels (S1-S3). The calculation formula of the central stock Pivot point is the arithmetic mean of three types of prices.
Pivot = (Max + Min + Close)/3
R1 = Pivot + (Pivot - Min)
R2 = Pivot + (Max - Min)
R3 = Max + 2*(Pivot - Min)
S1 = Pivot - (Max - Pivot)
S2 = Pivot - (Max - Min)
S3 = Min - 2*(Max - Pivot)
Max and Min are actual high and actual low; Close is the closing price.
2. Fibonacci pivot points. Fibonacci ratios are used to calculate the levels of deviation from the classic (floor) Pivot point. The calculation formula of the floor pivot line is the same as the classic one.
Pivot = (Max + Min + Close)/3
R1 = Pivot + (R*0,382)
R2 = Pivot + (R*0,618)
R3 = Pivot + (R*1,00)
R4 = Pivot + (R*1,618)
S1 = Pivot - (R*0,382)
S2 = Pivot - (R*0,618)
S3 = Pivot - (R*1,00)
S4 = Pivot - (R*1,618)
R = Max - Min
3. The Camarilla pivot point. The formula includes four support and four resistance levels without the basic pivot point. Ratios are included in the calculation, due to which the price contacts the levels more often. Therefore, Camarilla pivot points are often recommended for scalping and short-term Forex traders.
R1 = (Max - Min)*1,1/12 + Close
R2 = (Max - Min)*1,1/6 + Close
R3 = (Max - Min)*1,1/4 + Close
R4 = (Max - Min)*1,1/2 + Close
S1 = Close - (Max - Min)*1,1/12
S2 = Close - (Max - Min)*1,1/6
S3 = Close - (Max - Min)*1,1/4
S4 = Close - (Max - Min)*1,1/2
4. Woodie’s pivot points. The calculation formula is similar to the standard pivot points. However, standard calculators use four levels instead of six. Besides, the calculation for Woodie’s pivot points differs from other pivots because it places a greater weighting on recent price action data than other variations.
Pivot = (Max + Min + 2*Close)/4
R1 = Pivot + (Pivot - Min)
R2 = Pivot + (Max - Min)
S1 = Pivot - (Max - Pivot)
S2 = Pivot - (Max - Min)
5. DeMark Pivot points. Demark pivots compute only the upper resistance level and the lower support line. The approach to what is pivot point and the calculation of the base level is also different.
If Closing price is less than Open, Pivot = Max + 2*Min + Close
If Close is greater than Open, Pivot = 2*Max + Min + Close
If Close = Open, Pivot = Max + Min + 2*Close
S1 = Pivot/2 - Min
R1 = Pivot/2 + Max
There is no single “best” indicator. Each calculation method could be the best for a particular situation and particular asset. You can define the relevant Pivot calculation method only by testing your trading strategy. Read more about testing Forex trading strategies in the article devoted to the MT4 strategy tester.
Using pivot points in Forex trading
The Forex Pivot Points indicator builds the following horizontal levels:
P (PP) – the Pivot level
S – the Support level
R – the Resistance level
The ideal Forex market situation is considered to be when the candlestick opens below the P points, the price rises, slows down a little at the R1 point, gradually reaches the R2 point, and reverses.
The strategy of pivot points trading is based on the idea that the price action tends to return to the previous trading day's close more often than to go beyond the prior trading day range. Therefore, it is recommended to enter the D1 timeframe in the indicator settings. This means that the levels for the next trading day will be calculated based on the prior trading day closed candlestick.
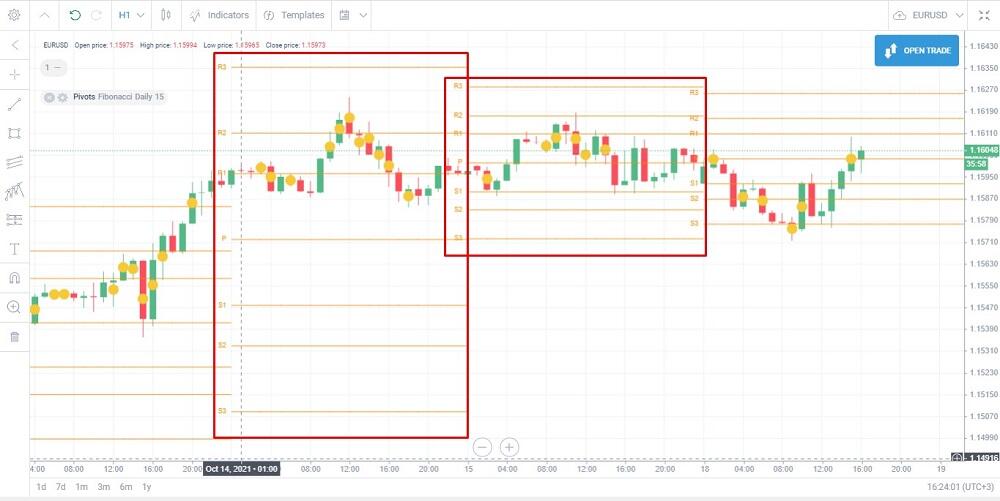
It is clear from the screenshot that the daily timeframe is in the indicator settings, the chart timeframe is H1. It means that the indicator will draw new horizontal levels every 24 hours. If you set the H4 in the chart, the levels will be updated every six hours; if you choose the D1 timeframe in the chart, the levels won’t be drawn.
The signals of the Pivot Point technical indicator:
The price action recent swing highs and lows are between the R1 and S1 points, and the Forex market crosses the Pivot point in both directions several times. This signals that the market is trading flat.
The price action breaks out points S3 or R3 — there is a strong downtrend or uptrend in the Forex market.
In the uptrend, the price, following a correction, runs into resistance R and breaks it out upside. This is a signal of the trend continuation, and one could enter a long. It is relevant to enter a short in the situation when the price breaks out the support level S in a downtrend.
An example of a trading strategy according to the Pivot Points.
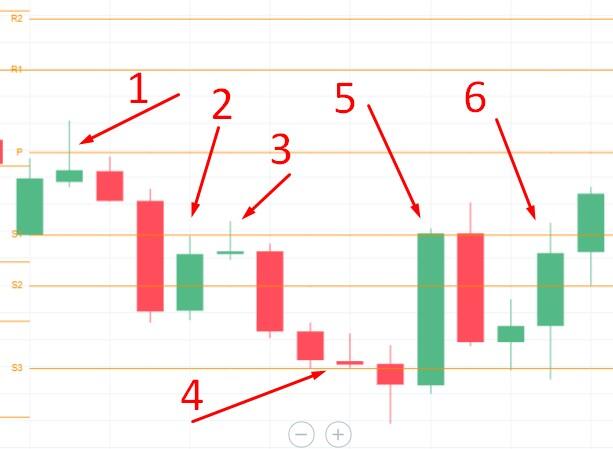
1 – The first rising green candlestick almost reaches the P level, the second rising candlestick closes higher than P. It is too early to suggest a trend, as the price hasn’t broken out of the R1 level.
2 – The price rebounds and breaks out the support level S1. One could enter a long with a take profit at S2. The Price breaks out S2 and corrects towards S1. Expect a signal, as the uptrend could continue.
3 – There appears to be a pin bar. It is a reversal pattern, so one could enter a short trade. Take profit is S2 and S1.
4 – There appears a candlestick looking like a pin bar and a Doji. It is time to be ready to open a long position with a take profit at S1 or S2.
5 – new reversal down after the price touches the horizontal level.
6 – new reversal up after the price touches the level.
How to add the Pivot Points indicator to MT4?
The Pivot Points indicator is not included in the standard indicator list. You can install it on the platform after you have downloaded its installation package on the Internet.
1. Write “download pivot points indicator MT4” in the Google search string. A few notes:
The versions offered by different websites can differ. You can download several versions and choose the most appropriate.
Give preference to investment blogs, sites with updated information, and many tabs as sources. This will eliminate the possibility of a virus in the running file.
Do not download the file if you are asked to enter your personal information.
The extension of the downloaded indicator file is .ex4.
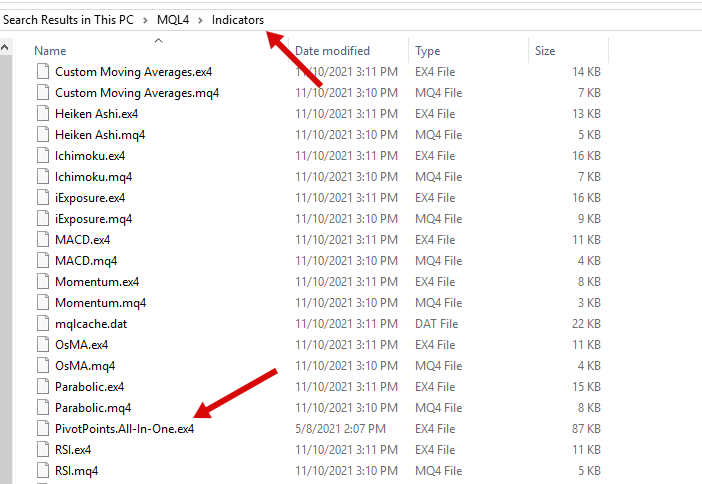
2. Go to your MT4, open the File menu, and click on “Open Data Folder.”
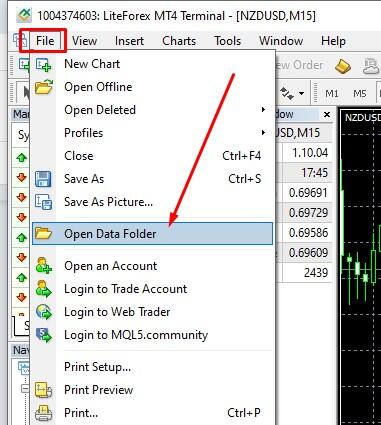
Open the “MQL4/Indicators” directory, paste the indicator file into the “Indicators” folder.
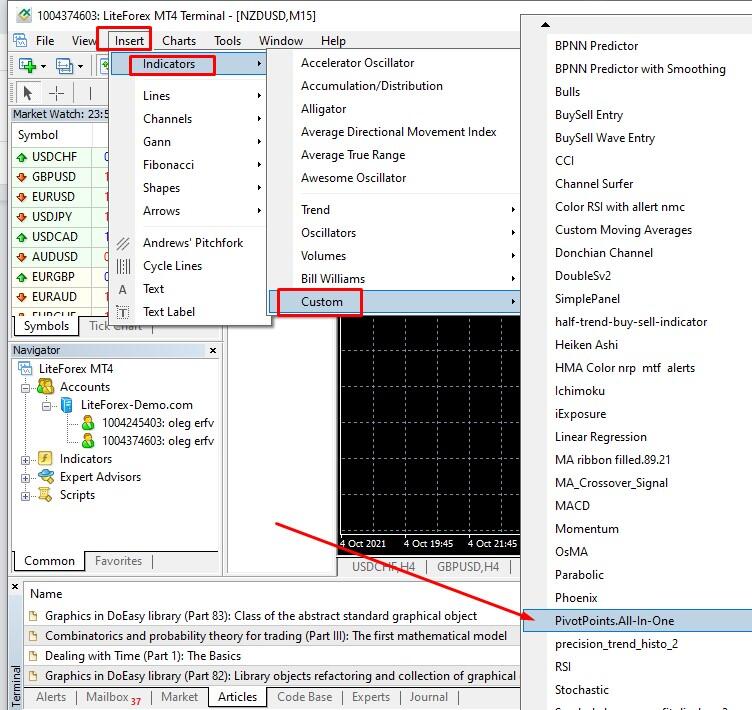
3. Start or restart the MT4. To find the indicator go to “Insert/Indicators/Custom.”
Indicator settings:
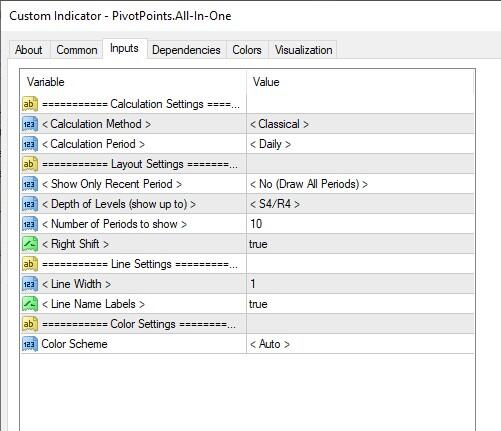
You can choose one of the five calculation methods, the number of levels, interval, calculation period.
How to use the Pivot Points on the LiteFinance platform?
Unlike the MetaTrader, the LiteFinance terminal already has the Pivot Points indicator in the standard list.
1. Run the terminal. If you haven’t yet registered, you can try trading with the indicator without registration on a demo account. On the website’s main page, click on “For Beginners/Open a demo account” in the top menu.

2. Open the trading chart of any asset and click on the “Indicators” tab.
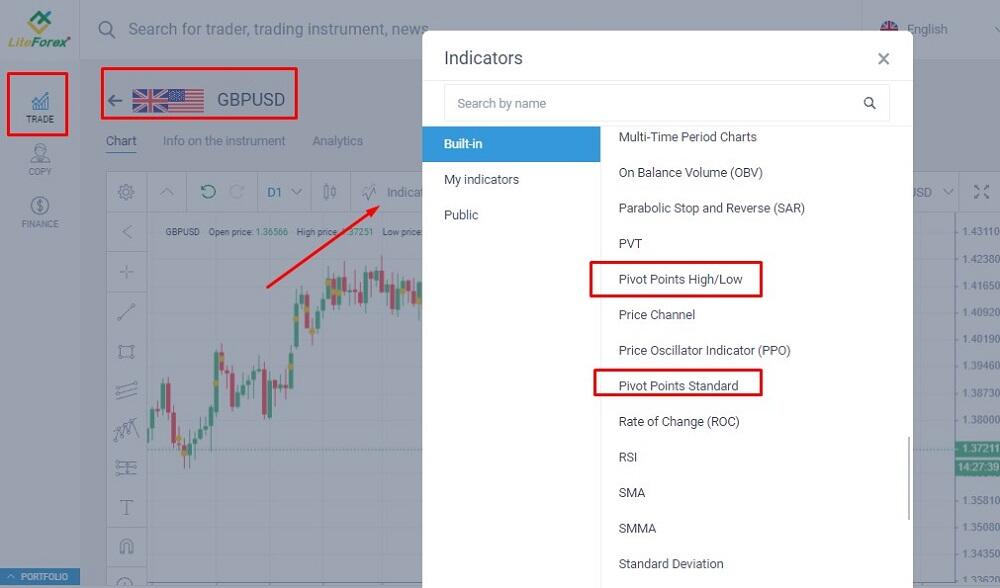
There are two tools named Pivot Points in the list.
Pivot Points High/Low. The indicator marks price action extremes in the price chart and displays the recent High/Low values. You specify the calculation period in the settings; it is the number of candlesticks analyzed to define the extreme. The shorter the period, the more extreme prices will be shown by the indicator, but they still will be significant. You can set separate periods for highs and lows.
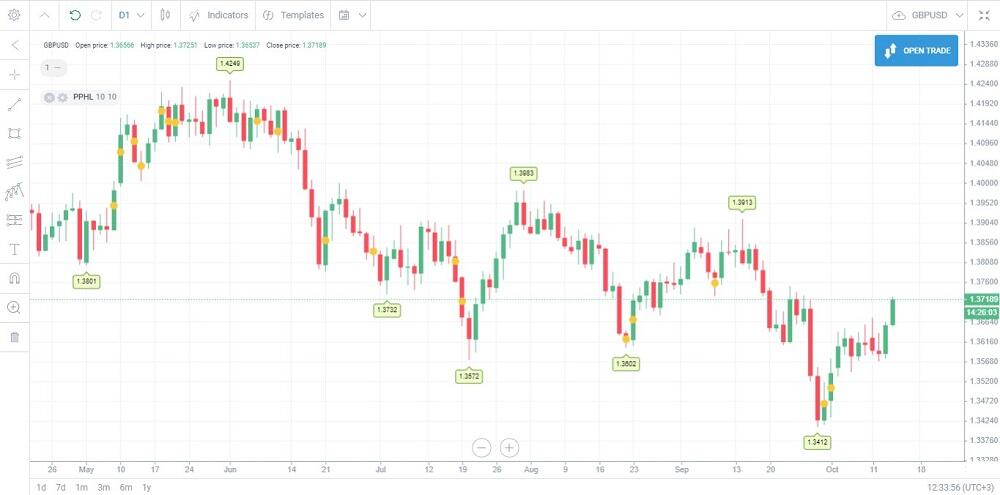
The tool helps you define the local and the key potential support and resistance levels.
Pivot Points Standard. You can choose any calculation period in the settings, classic, Woodie’s, Camarilla, etc.
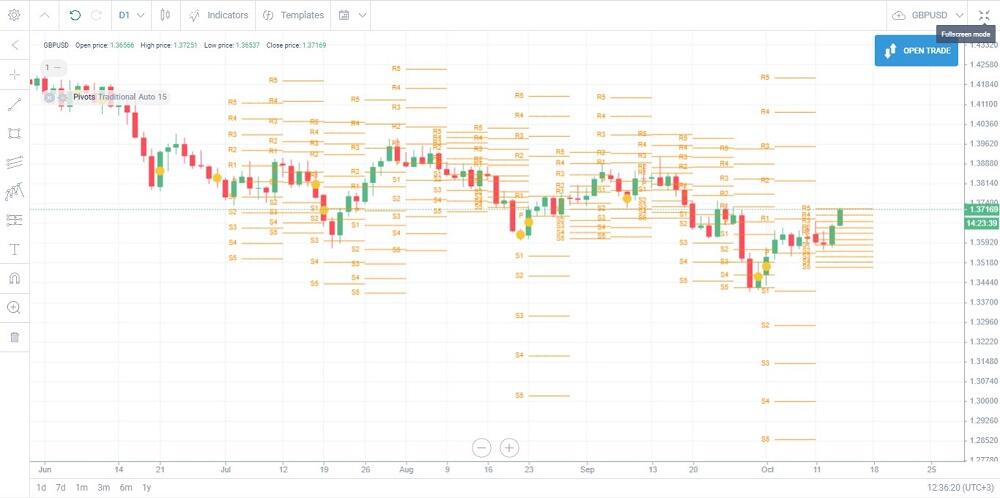
The indicator helps to calculate the most likely price pivot points. For example, you can attach several indicators to the chart with different calculation methods. If the likely support and resistance levels, determined with different methods, coincide, they could serve as the key levels.
Pivot point trading strategies
Trading by Pivot Points. Below, you will find several examples of using the Pivot Points indicator to get confirming signals, defining the likely trend reversal points.
Trading strategy based on the Pivot Points in the GBP/USD chart
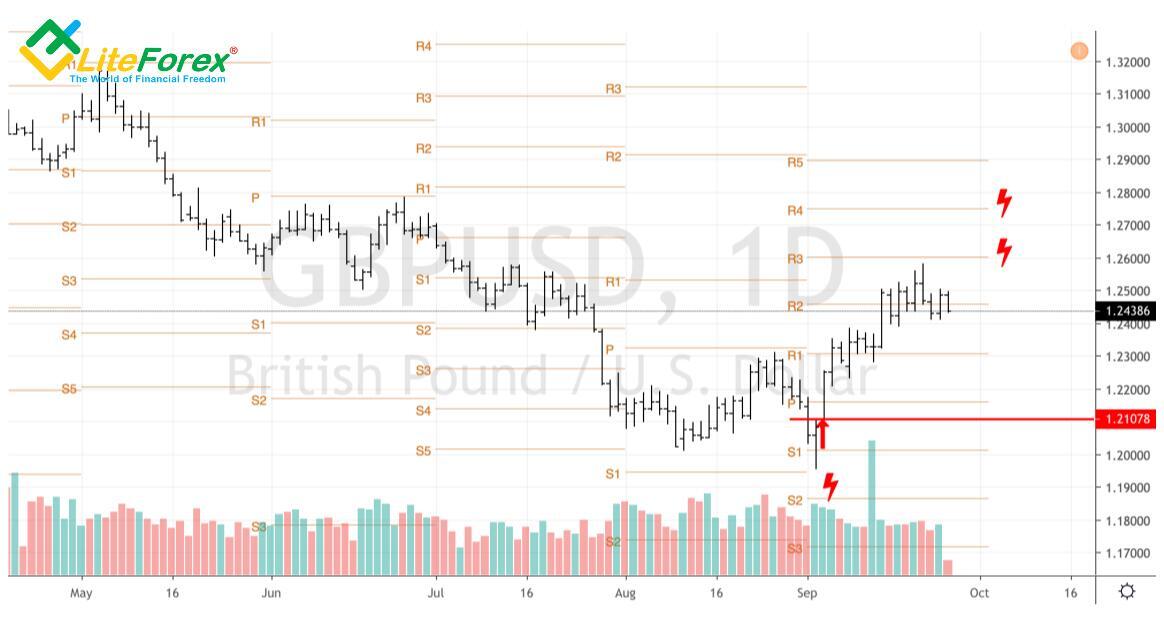
As I noted in the above example, one had better use several methods to identify the support and resistance levels. If the levels, provided by different tools, coincide or are close to each other, and the price is moving near the control zone, even a newbie can consider entering the next trade. So, in the case of sterling, plotting the Fibonacci pivot points levels and the consolidation of the GBPUSD pair near the zones of their combination with the Pivot levels indicate that the trading decision is correct.
Fibonacci and Pivots in the GBP/USD chart
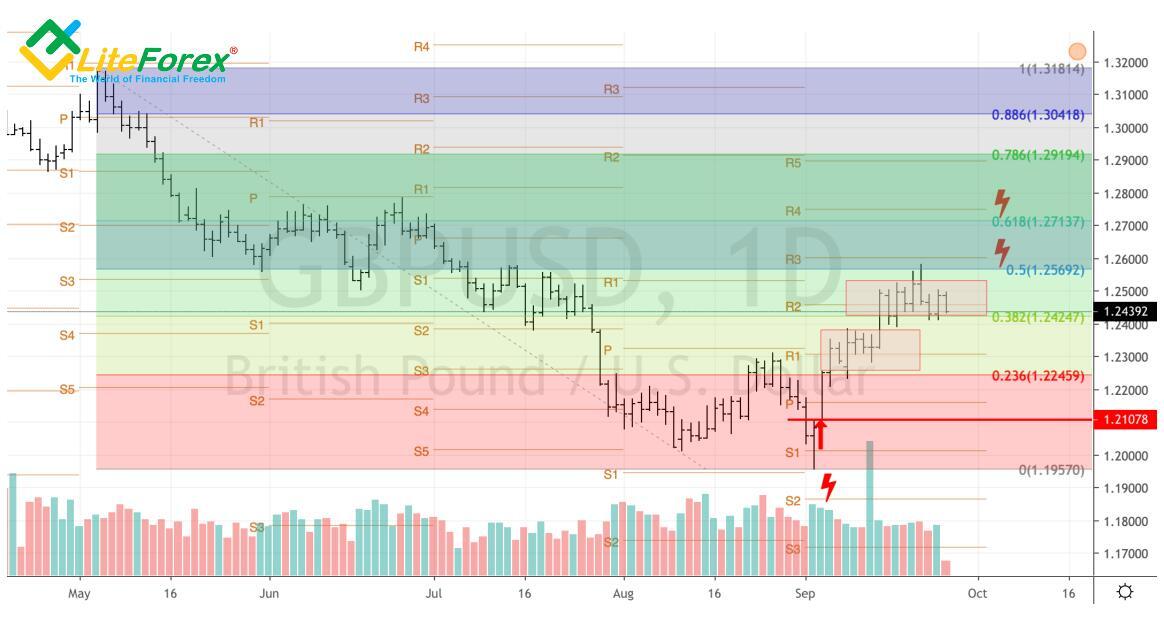
The combination of Pivot levels with such a technical analysis indicator as a descending or ascending trading channel seems to be quite effective. A breakout of the upper border of the first of them on the daily GBP/USD chart near 1.26 will increase the chance of the pound's continued rally against the US dollar.
Start trading with a trustworthy broker
Pivot point formula — how to calculate the indicator
The calculation formulas for the major types of Pivot Points are presented above. One should know the calculation theory at least to understand the construction principle. In real trading, nobody calculates the levels manually. Professional traders employ either indicators, automatically building reference points according to the input parameters, or calculators. An example of a pivot points calculator is on the Investing website.
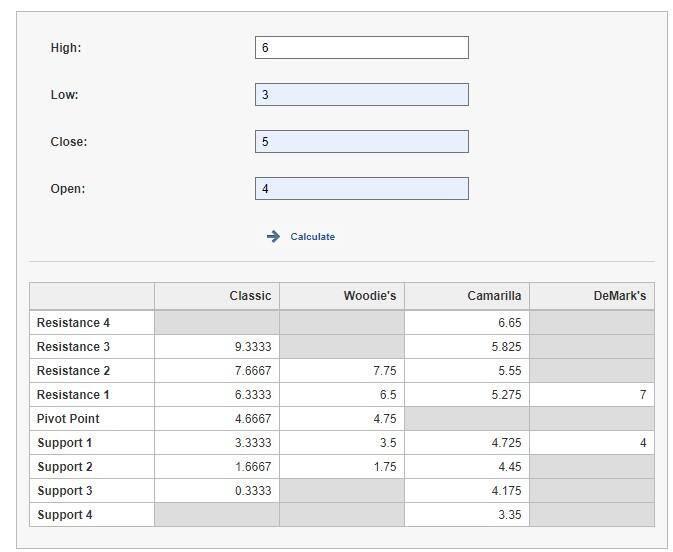
The calculator displays the levels drawn according to each method and the difference in the calculated values.
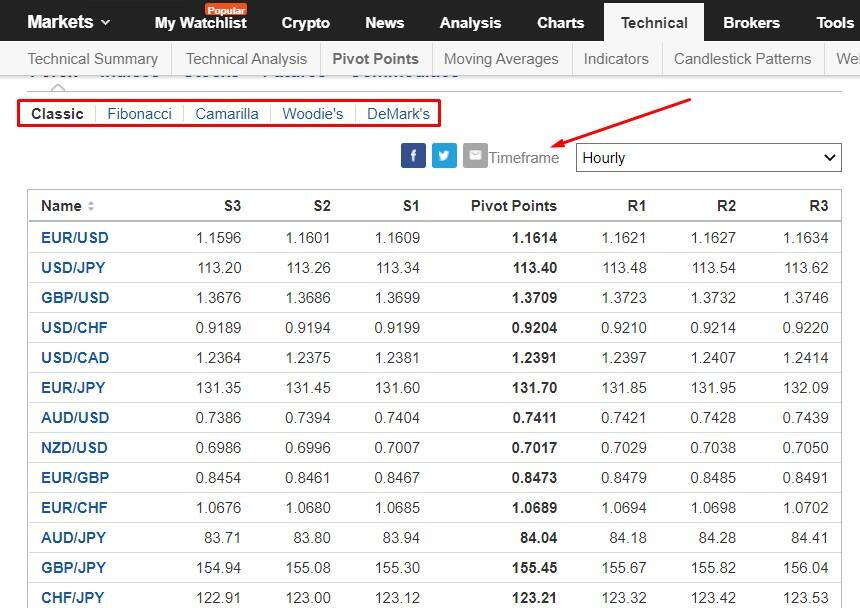
Another variant is to study the values of the calculated horizontal levels for each currency pair. You can find them in the section “Technical/Pivot Points.” You can choose the timeframe in the table.
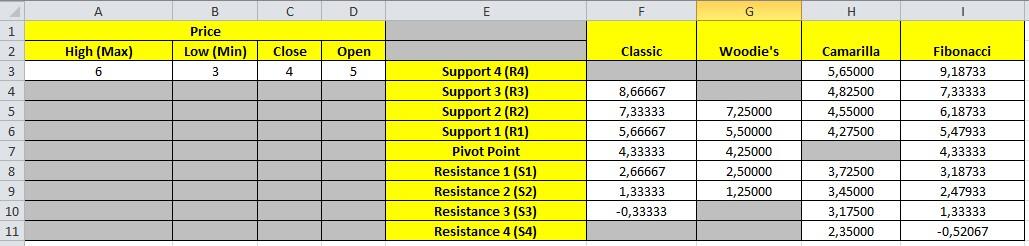
How to calculate Pivot Points in Excel?
If you do not trust the calculators of analytical portals and downloaded indicators, you can use Excel to find out turning points. In Excel, you can see the formula and correct it at your discretion. Download quotes for Pivot Point from MT4 in the appropriate format or enter them manually. The template of the Excel spreadsheet for Pivot Points can be downloaded here.
What Do Pivot Points Tell You?
How to trade using Pivot Points:
It determines the points of potential level breakout or trend reversal. If one of the important levels is broken out, the price is likely to go further towards the next level. If the trend has reversed, the price could be corrected at least to the previous trading day level.
It considers psychological effects. The crowd effect is triggered. If many traders simultaneously set, for example, take profits at the R2 level according to the Pivot Point trading strategy on an uptrend, the trend will turn at R2. Therefore, it is not the Pivots indicator that predicts the trend reversal, it is the behaviour of many traders, using the tool, that becomes a reason for the price swing highs and lows.
It helps to determine the levels for take profit, stop loss, pending orders.
Pivot Point is also a tool to trade according to important levels or channel strategies based on Bollinger Bands or Keltner Channel. It is not worse or better than other tools, it is a complementary indicator, although it also has its soft points. The Pivots indicator could be used in scalping when the price is moving between the levels, trend trading on the level breakouts.
Pivot Points: pros and cons
Advantages of Pivot Point:
It automatically calculates the most likely price turning points according to different methods.
It is well combined with other confirming tools: Fibonacci levels, trading channel indicators, reversal patterns.
It is suitable for strategies employing pending orders. The indicator helps to calculate reference levels which the price is likely to hit or break out and follow with a reversal.
Drawbacks of Pivot Point:
Settings and choosing the right method could be quite complex. The Pivot Points indicator has six methods to calculate the levels and several timeframes. The parameters relevant in the current situation may not work in the future.
- It is difficult to analyze. During the trading day, the price can cross the daily pivot level several times. This confuses beginner investors and complicates the analysis of the trading day pivots.
To reduce the likelihood of an error, use several instruments to determine turning points on the base of the previous day. For example, draw the levels according to highs/lows, follow chart patterns, add channel indicators. The more levels coincide with the Pivot Points data, the more likely is the prediction to be correct.
Support & Resistance Levels
The rules to use Pivots in Forex trading are similar to trading Fibonacci levels or support/resistance levels. If the price is above the P line, the central pivot level, it should continue rising. If the price is below the P level, it should continue falling. The nearest turning points are R1 and S1. If the price breaks out one of these levels, the next target levels are R2, S2. The further the price breaks away from the middle line P, the greater the pre market volatility and the greater the likelihood of a price reversal to the center level. Therefore, points R3, S3 are considered the most important. Their breakout indicates a strong movement. But more often, the price reverses to P.
Example:
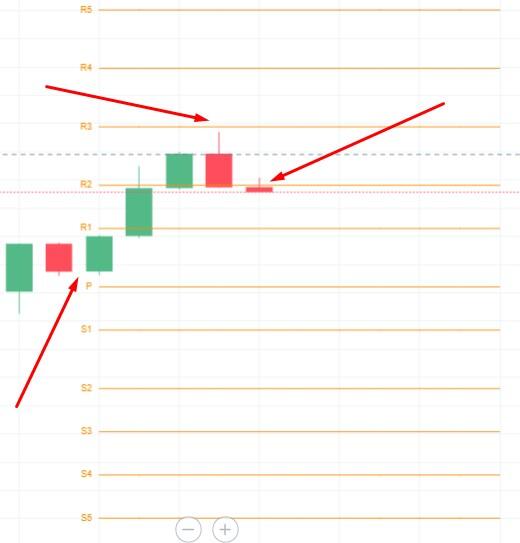
At the beginning of the period, the price was above the P line, confirming the uptrend. Next, the price breaks out the R2 level but closes a little higher, signaling a strong level. At the next candlesticks, the R3 serves as a strong resistance level, and the price has almost touched it and started to consolidate again close to R2. If it is a correction, the price could go to R3 and higher. If the price covers at least 50% of the distance between R1 and R2, we could consider a downtrend with the first target around the P level in the current trading situation.
Pivot points key takeaways
Pivot Points are horizontal key levels, which professional traders use to determine the entry point. The level breakout signals one to enter a trade in the trend direction. If the price rebounds from the level, there could start a correction or a counter-trend.
The Pivot point is based on the average of the high, low, and closing prices of the prior trading day or period. It helps to determine the potential pivot levels for the current trading day.
The Pivots indicator draws key levels in the chart according to several methods, classic, Woodie’s, Camarilla, Fibonacci, DeMark’s. The choice of the Pivot levels calculation method depends on the trading strategy, pre market situation, and trading asset.
- Pivot point stock trading and trading Forex. Interpretation of the Pivots indicator’s signals. If the price is moving between R1 and S1, the market is trading flat. If the price breaks out level R2 or R3 upside, the trend is up. If the market breaks out S2 or S3 downside, the downtrend is signaled. One can also employ the Pivot Points indicator in swing trading. For example, a correction to the uptrend starts at the R3 level, and the trade is entered at the end of the correction at R2.
Pivot Point trading: summary
Pivot Points are one of the great leading indicators that helps one identify support and resistance levels. The combination of Pivots with other technical analysis tools allows developing profitable trading strategies. Pivot Point is a supplementary tool used together with trend trading or channel trading strategies. The advantage is that you don’t have to calculate the levels manually. The drawback is that the Pivots indicator doesn’t draw trendlines, indicating only horizontal levels. When trading with Pivot Points, take into account fundamentals, confirm the trend reversal using other tools, chart patterns.
Pivot Points FAQ
Pivot Point is a technical analysis indicator applied together with other trading day tools building horizontal levels. For example, it is well combined with Fibonacci levels, important levels built along with highs/lows. If different levels coincide, this is a key level. You should also follow the trend in the market. If the price breaks out points S2 downside or R2 upside, this is a signal to enter a trade. A pending order is put a little lower than S3 or a little higher than R3. If the price movement reverses at points S3/R3, the order won’t open, and you won’t suffer any losses. To find out if this indicator fits your trading day strategy and before opening your first trade, make a thorough research and advise industry experts.
Depending on the market situation, trading asset, and timeframe:
- Camarilla Pivot is more suitable for scalping.
- Each version of the pivot points has a timeframe in the settings. The change in the timeframe results in widening or narrowing the levels.
- The accuracy of the signal to pivot trade and levels built can be affected by the market volatility. When you trade according to levels based on Pivot Point while using the trading day strategy, take into account fundamental factors affecting the prices. You should also mind the reward and risk ratio for a potential trade.
In the classic method, according to the pivot point meaning, the base level is calculated by dividing the sum of the high, low, and closing prices by 3. The calculation methods differ in the use of different techniques when calculating the levels R and S. For example, more weight may be given to the Close price of the trading day, or distances to levels may be corrected for Fibonacci ratios.
- Use the pivot point calculator. Input data are High, Low, Close prices.
- Use the calculations offered by analytical portals. For example, you can find pivot points on the Investing website.
- Add the Pivot Point tool to the chart. It will automatically build levels according to the method specified in the settings.
Any trading day strategy needs day traders to adjust indicators according to the asset type, current market sentiment, situation, timeframe. Each version of the Pivot Points can be appropriate to find out daily pivot points for particular conditions and strategy parameters. Day traders can decide which parameters are optimal for intraday pivot trading only after testing the system on historical data.

The content of this article reflects the author’s opinion and does not necessarily reflect the official position of LiteFinance broker. The material published on this page is provided for informational purposes only and should not be considered as the provision of investment advice for the purposes of Directive 2014/65/EU.
According to copyright law, this article is considered intellectual property, which includes a prohibition on copying and distributing it without consent.