Let us have a look at the rules of head and shoulders pattern trading. One of the most popular Price Action patterns is the Head and Shoulders pattern. So, what is a head and shoulders pattern? The unusual name arouses the interest of many novice traders to study this model and the rules to trade in financial markets.
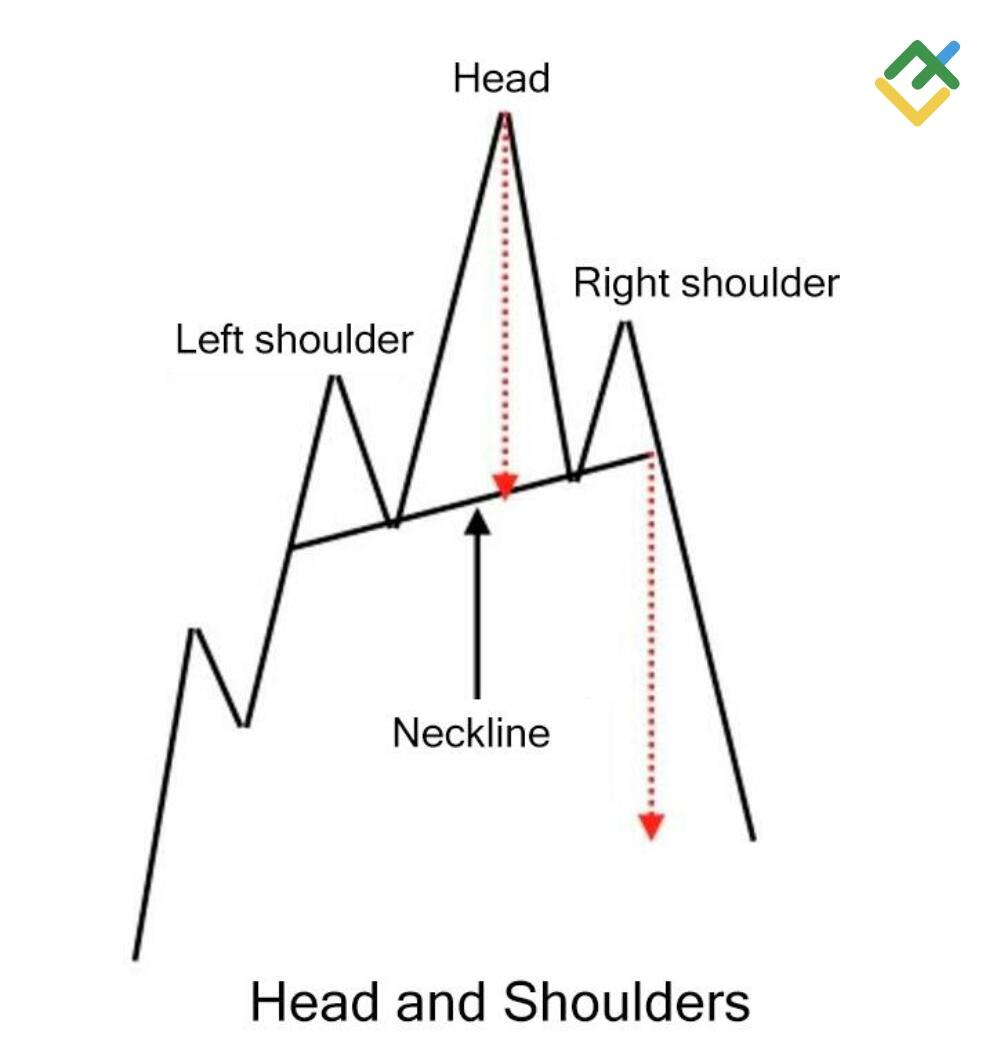
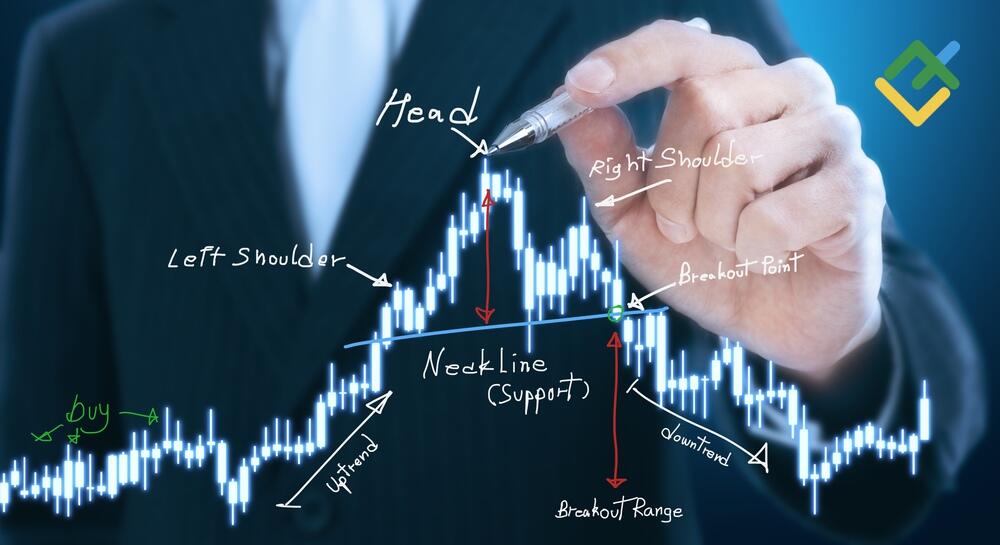
Why head and shoulders? The answer is simple. The pattern has three local tops that resemble the left shoulder, head, and right shoulder. The main feature is that the right shoulder in the classic formation should be slightly higher than the left. However, this does not always happen, the shoulders can be symmetrical. The main line from which the trade entry point is determined is the “neckline”. Is a head and shoulders pattern bullish or bearish? What does a head and shoulders pattern mean, and how to trade its signal? Read on, and you will know!
Having read this article, you will know what a head and shoulders pattern means in a stock market chart and in Forex and how to trade its signals.
The article covers the following subjects:
- Major takeaways
- What Is a Head and Shoulders Pattern?
- Understanding a Head and Shoulders Pattern
- What Does a Head and Shoulders Pattern Tell You?
- Inverse Head and Shoulders
- How to Trade the Head and Shoulders Pattern
- Head and Shoulders trading strategy
- The Market Actions Behind the Head and Shoulders Pattern
- The Pitfalls of Trading Head and Shoulders
- Conclusion
- Head and Shoulders Pattern FAQs
Major takeaways
Main Thesis | Insights and Key Points |
Definition | The "Head and Shoulders Pattern" consists of three local tops resembling a human's left shoulder, head, and right shoulder. |
What Does a Pattern Tell You? | The "Head and Shoulders Pattern" indicates that an uptrend might be exhausting, suggesting a potential price reversal. |
Inverse Head and Shoulders | There are variations like the Inverse "Head and Shoulders Pattern" that indicate a bullish trend in the market. |
How to Trade | To trade the "Head and Shoulders Pattern", emphasis is placed on the importance of the neckline and its role in determining entry points. |
Trading strategy | The "Head and Shoulders Pattern" can be combined with Japanese candlesticks and indicators like MACD, RSI, and Stochastic for better trading decisions. |
Benefits | Reflects market psychology, can be found in various markets, and provides insights into potential price movements. |
The Pitfalls | Requires careful analysis. Challenges can arise, such as bear and bull traps, necessitating additional confirmation signals. |
What Is a Head and Shoulders Pattern?
Well, what is head and shoulders pattern? The Head and Shoulders market pattern is a classic price pattern, which refers to reversal formations in trading. What does head and shoulders pattern mean? A head and shoulders chart pattern meaning is that the uptrend is exhausting, and the price could reverse soon.
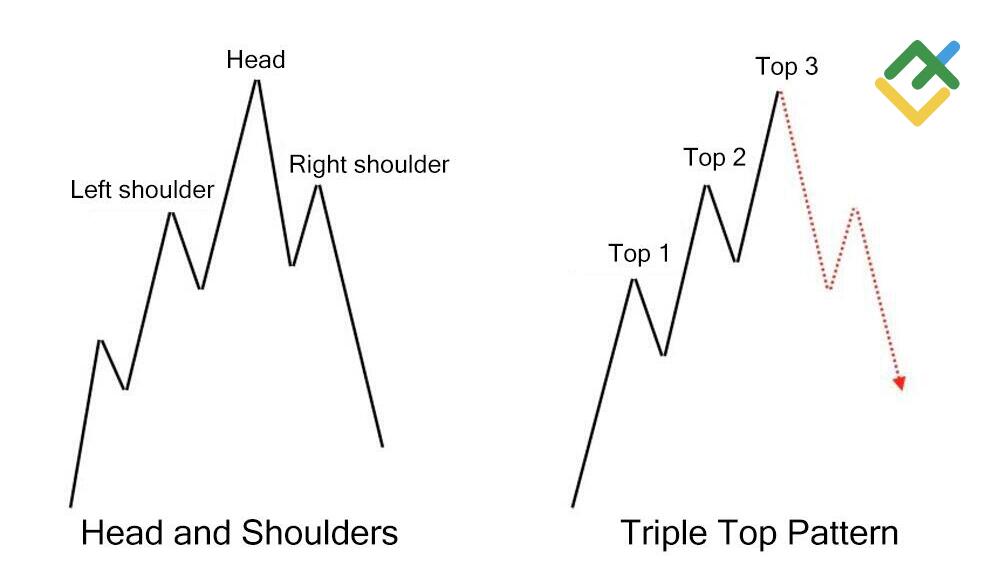
What does a head and shoulders pattern look like? The head and shoulders formation is a modified form of the three tops pattern. However, three local or new tops are successively formed in the three tops pattern, and the asset price begins falling sharply. The head and shoulders formation also has three local tops, only the highest of them is in the center.
Understanding a Head and Shoulders Pattern
The head and shoulders chart pattern appears in all kinds of markets, including Forex, cryptocurrency, commodities, stocks, and bonds.
You can define this pattern both in the shorter timeframes and in the longer ones. The difference is that in longer timeframes, the pattern works more efficiently, as there is less market noise than in short timeframes.
What Head and Shoulders Pattern Looks Like
A head and shoulders trading pattern takes a longer time to form due to its volume.
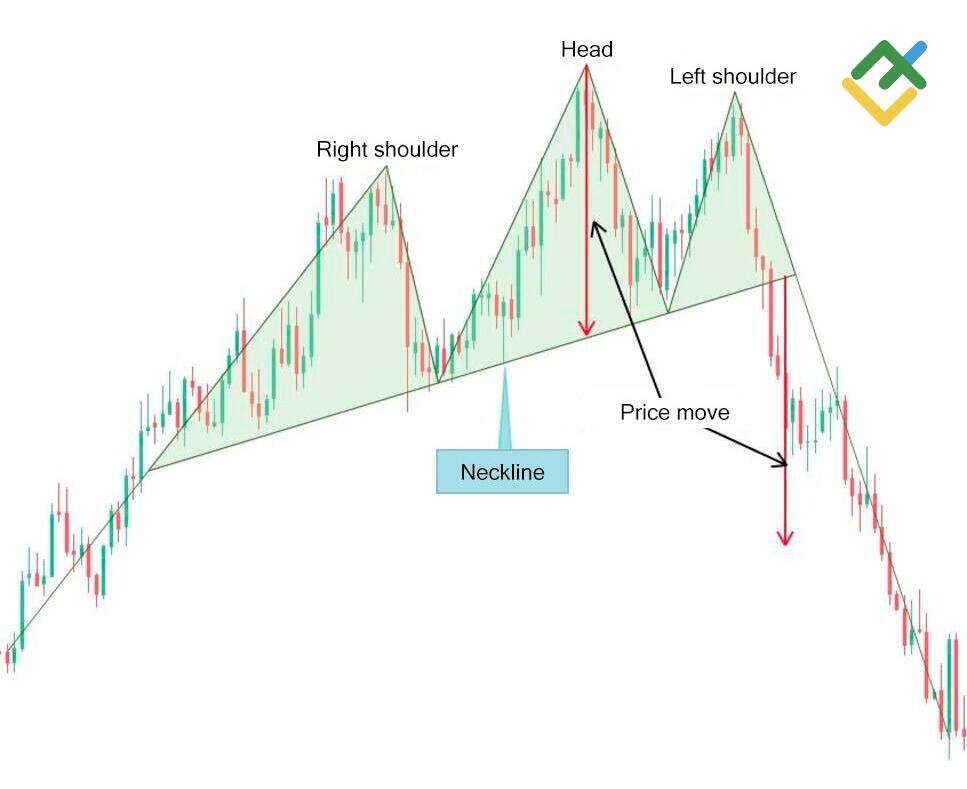
The head and shoulders pattern has three tops, which are three price highs. In this case, the central top should be higher than the highs on the sides, which are called the shoulders of the pattern. The shoulders are approximately at the same level, but the distance between them may differ.
Another interesting name for this pattern is Three Buddhas. This is quite logical; in Buddhist temples, according to tradition, a large Buddha figure is placed in the middle, and two smaller figures are displayed on both sides. It is noteworthy that in Western technical analysis, the Three Buddhas pattern had been used long before the stock head and shoulders pattern was discovered. This suggests that in the psychology of market participants, there are no differences on a national basis.
What Does a Head and Shoulders Pattern Tell You?
Is the head and shoulders pattern bullish or bearish? The head and shoulders chart in a bullish market depicts a bullish-to-bearish trend reversal and signals that an upward trend is nearing its end. An inverse head and shoulders formation in a bearish market means the trend must have reached its bottom and could turn up.
Tug-of-War
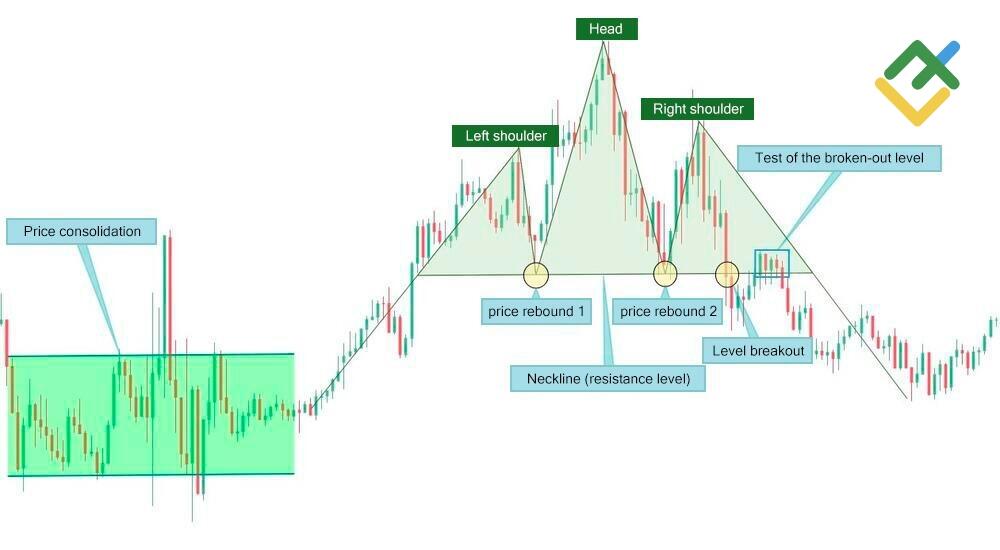
On the technical analysis chart, the head and shoulders pattern forms following an uptrend and asset price consolidation. However, head and shoulders can appear in a downtrend; in this case, it will be a trend continuation pattern, meaning the price will be falling deeper. Following the first top, left shoulder, the price goes down to the support level and bounces off. At the first rebound, bulls go ahead and drive the price higher than the first high, forming the Head of the pattern.
After an intense upward movement, buyers run out of strength, and, as a rule, the price corrects down to the support level. At the same time, a drop in volumes is observed, and the right shoulder is formed, at the top of which the bulls finally retreat, and the price goes down to the support level and breaks it out downside.
Further, the price could test the broken-out level, but then the downtrend intensifies, and the price continues falling.
Head and Shoulders bullish pattern
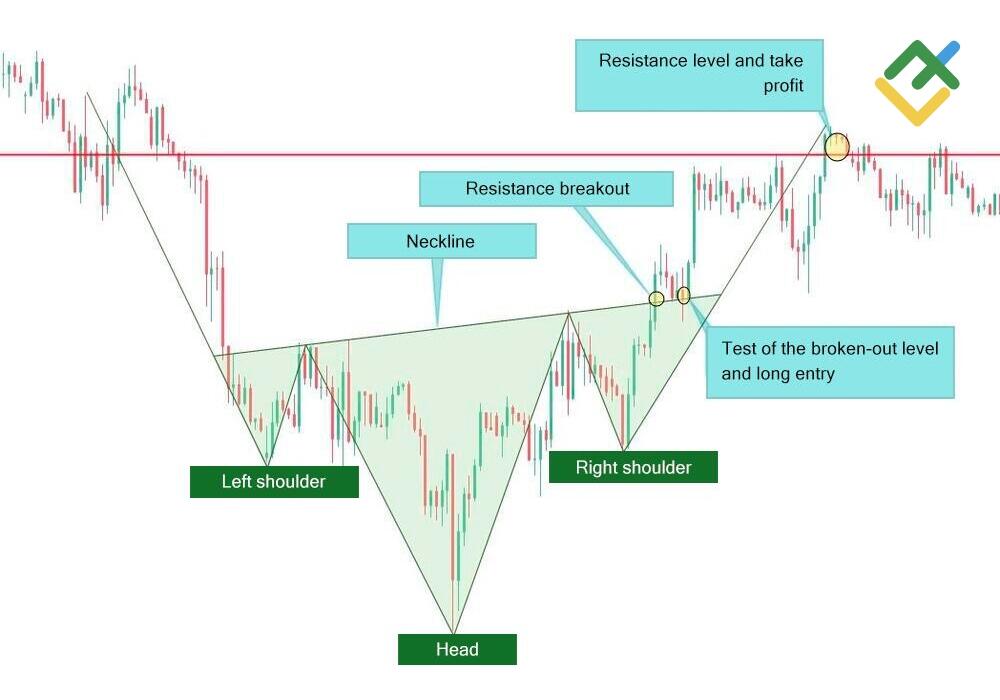
A bullish head and shoulders pattern is an inverse head and shoulders. A bullish formation appears in a downtrend and signals a bearish-to-bullish trend reversal. The positions are opened according to the same logic as in a bearish modification. You need to expect the breakout of the neckline and its test. Then the bullish head and shoulders pattern stocks, for example, signals to enter a long.
Head and Shoulders bearish pattern
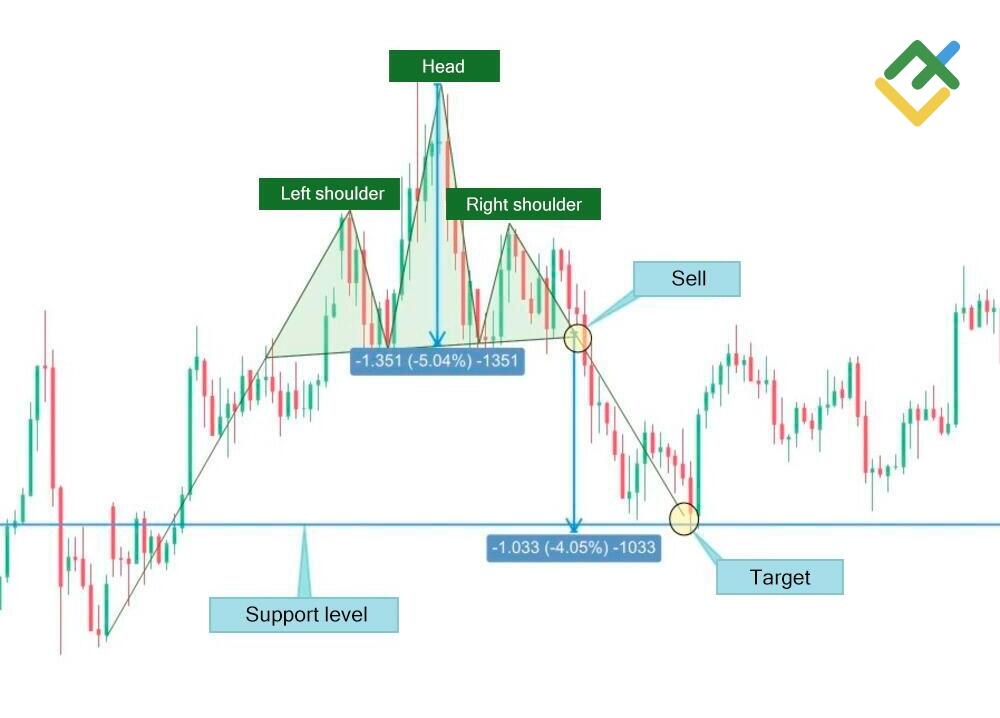
The head and shoulder chart depicts a trend reversal from bullish to bearish. A bearish head and shoulders stock pattern forms at the top of a trending range and signals that buyers cannot move the price above a certain resistance level.
After the top of the second shoulder forms, the price reverses down, reaches the neckline level, and breaks it out. At this moment, a sell trade is entered. Most commonly, a target profit is defined by the Head length, i.e, the distance between the neck and head top, considering the nearest support levels. However, there are cases, when the price sharply falls and breaks out support levels one by one.
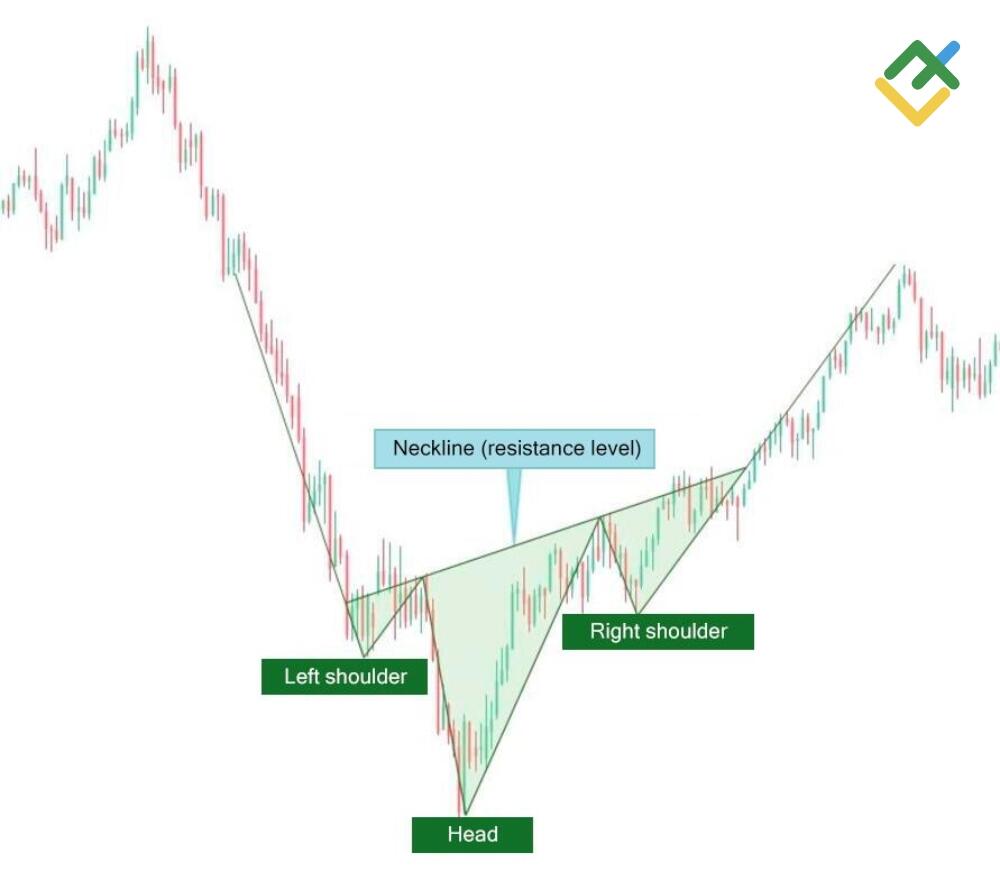
Inverse Head and Shoulders
The inverse head and shoulders pattern in technical analysis is the exact opposite of the regular head and shoulders formation. It precedes a bullish trend and warns bidders that the bearish momentum is exhausting. It’s easy to spot a buy entry based on an inverse head and shoulders pattern in a chart. It looks like a head and shoulders pattern, only reversed. If the head and shoulders in trading resemble three tops, then the inverse pattern looks like three bottoms.
The trading strategy based on an inverse bullish head and shoulder pattern is similar to the one based on regular formation. A long trade is entered following an impulse breakout of the neckline, which is a resistance level.
An example of an inverted head and shoulders pattern can be seen in the UKBRENT price chart.
How to Trade the Head and Shoulders Pattern
Let us explore the rules of trading based on the Head and Shoulders pattern. I take the daily BTCUSD chart as an example.
Placing the Neckline
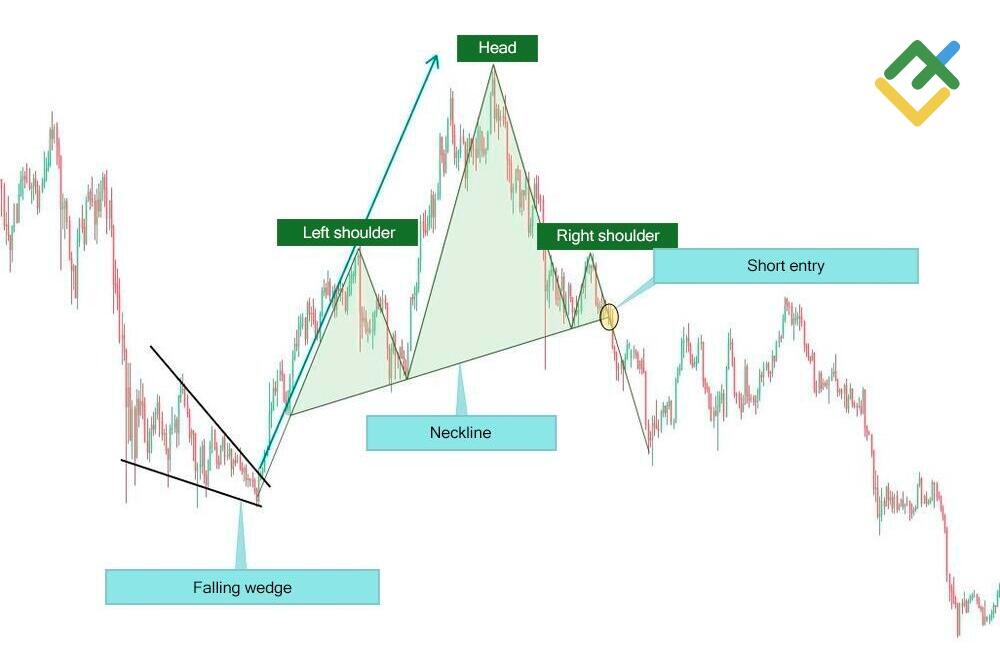
The key factor to spotting a head and shoulders pattern in the chart is to define the neckline correctly. The entry points are based on the neckline level in the chart. You can see in the chart below that the head and shoulders pattern stock is preceded by a falling wedge. It warns traders about a soon reversal up following a long downtrend. You can read more about the falling wedge and other price patterns in the article devoted to 10 day trading patterns for beginners.
The screenshot shows how, after the formation of the first top, the price corrects down to a certain level, and then turns up again and forms a high second top. Then the price goes down again. When it reaches the neckline, it bounces up again, and the right shoulder forms, that is, the third top. Then the market moves down and breaks out the key support level (neck) and goes further down.
At this moment, a short trade should be opened; bulls can’t keep their positions, and bears take control of the market.
Placing Your Stops
Stop-loss when trading the head and shoulders pattern is placed above the neckline in accordance with the risk management rules and the principles of money management, while the distance depends on the timeframe and financial instrument. For example, in the daily Forex price chart, an acceptable stop loss level is 400-500 basis points from the entry point. In the stock market, with a conservative strategy, a stop loss can be placed at 20-50 pips from the level where the position was opened. If short timeframes are used, then the stop loss can be set above the right shoulder.
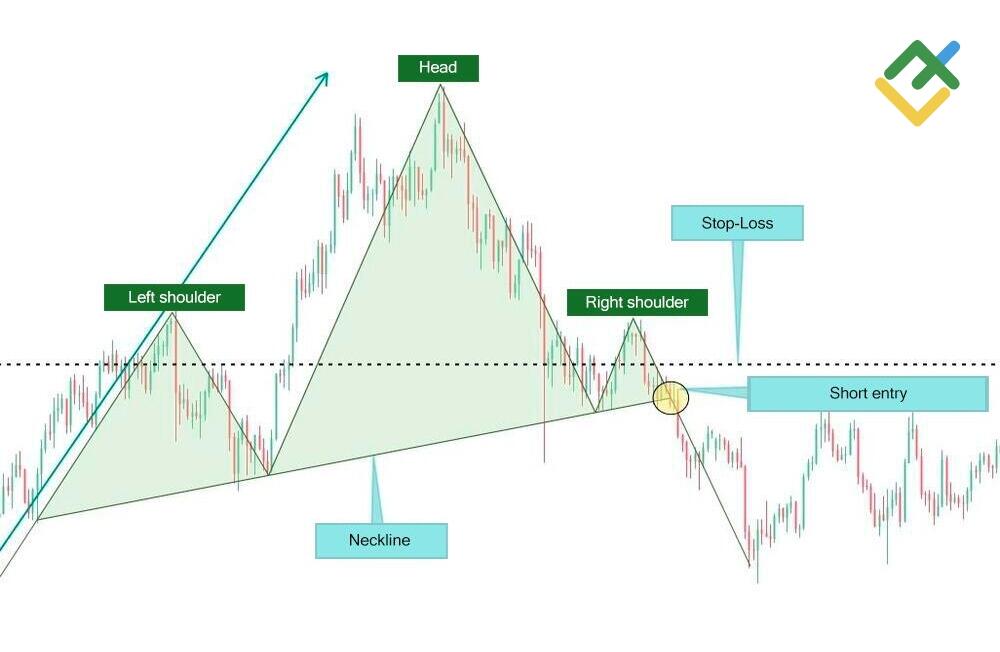
Setting Your Profit Targets
A take profit is set at the distance equal to the head height or at the support level. In our case, there is a bearish flag pattern within the trading pattern Head and Shoulders. Here it is easy to set a take profit. The target for a bearish flag coincides with the support level. When the price exits the flag, the movement should be equal to the flag pole length.

Head and Shoulders trading strategy
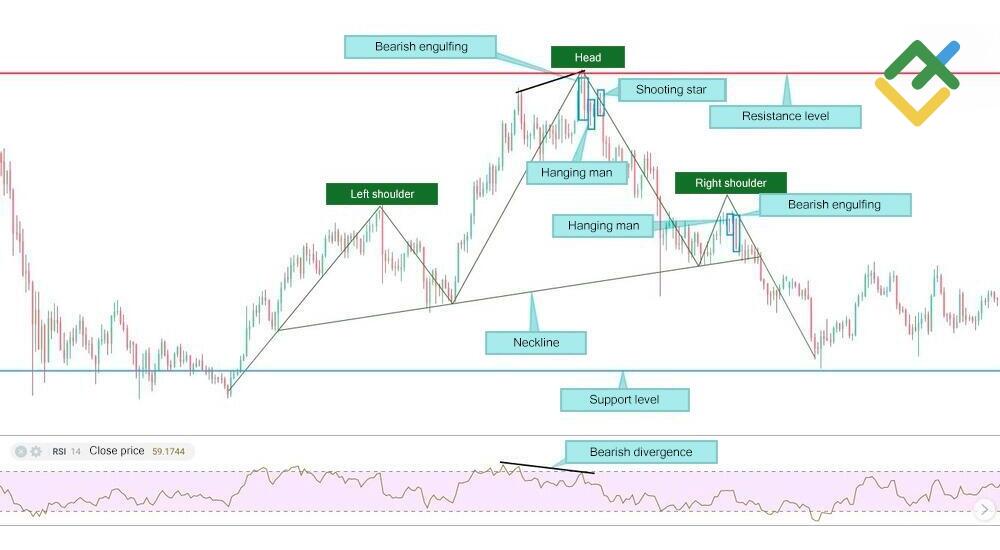
Technical analysis of the head and shoulders pattern can be combined with Japanese candlesticks and indicators.
To confirm the pattern and define optimal entry points, one could apply candlestick patterns or technical indicators, such as the MACD, RSI, and Stochastic.
Let us take the same BTCUSD chart as an example.
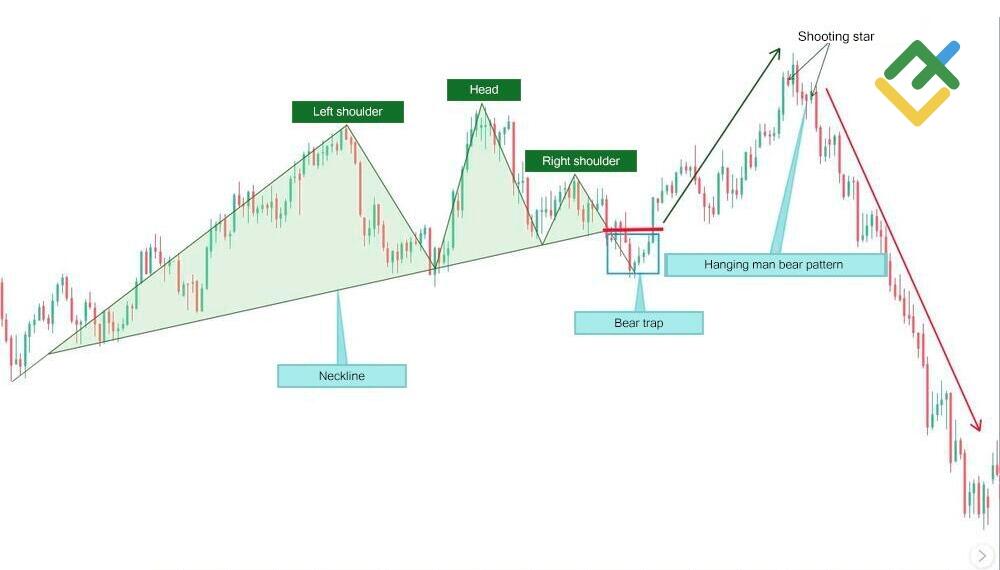
You can see from the screenshot that the indicator defines a bearish divergence, namely, the level where the asset price starts reversing. The head and shoulders pattern also has some reversal candlestick patterns inside. You can read more about candlestick analysis in the article How to read candlestick chart.
The price reversal is also confirmed by three candlestick patterns: the bearish engulfing pattern, a hanging man, and a shooting star. After the right shoulder is formed, there is also a hanging man and a bearish engulfing pattern, which signal an approaching breakout of the neckline. One could have entered a sell trade before the price breaks out the neckline level.
The Market Actions Behind the Head and Shoulders Pattern
The financial market is a hectic place, sometimes chaotic and illogical.
But the market, first of all, should be considered from the point of view of the psychology of people's behavior. What happens after head and shoulders pattern? Anything, for example, other large patterns can be built, for example, "bull flag", "double bottom", "wedge," and other formations.
As a rule, what happens after a head and shoulders pattern is that the asset price chart can consolidate for a long time and build other models that signal an increase or decrease in the price.
The Pitfalls of Trading Head and Shoulders
Difficulties can arise when trading with Japanese head and shoulders candlesticks, including bear and bull traps. Therefore, before opening a trade, it is necessary to confirm the current trend using other signals, such as candlestick patterns or technical indicators.
Conclusion
It should be noted that the head and shoulders pattern is a convenient chart formation that could be traded in any timeframes and financial markets, including Forex, stock, commodity, and cryptocurrency markets. The pattern can be either bullish or bearish, which allows a trader to make profits from the price rally and the price decline.
The head and shoulders pattern meaning is a reversal pattern, and it signals that the strength of the previous trend is weakening, and the price movement could reverse. In the technical analysis head and shoulders pattern, it is important to refer to other candlestick patterns, as well as technical indicators, oscillators, and stochastic indicators.
To put the acquired knowledge into practice, you can use the LiteFinance demo account with a convenient and functional trading terminal and a wide range of trading instruments.
Head and Shoulders Pattern FAQs
The measured move of the chart is a reference point for the target profit level. For example, in a head and shoulders pattern, the measured move would be the height from the peak of the middle top (head) to the neckline. Next, this segment is tried on to the segment from the neck level and below, to identify the level for a take profit.
One must consider the neckline. If the price breaks it out upside and the pattern is the inverse head and shoulders in a downtrend, enter a long trade. If there is a regular head and shoulders pattern in an uptrend, and the price breaks out the neckline downside, enter a short trade.
A bearish head and shoulders pattern is a common reversal pattern that appears in a bullish market. When the third top forms in the pattern (the right shoulder), the price reverses, and a new downtrend starts.
A bullish head and shoulders pattern is also called an inverse or reverse head and shoulders pattern. It appears in a bearish market and signals a trend reversal up. When the price reaches the head low, it turns up, and a new bullish trend starts.
As with any other financial asset, the BTC price chart also forms a head and shoulders pattern, providing profitable trading signals.
Price chart of AUDJPY in real time mode
The content of this article reflects the author’s opinion and does not necessarily reflect the official position of LiteFinance broker. The material published on this page is provided for informational purposes only and should not be considered as the provision of investment advice for the purposes of Directive 2014/65/EU.
According to copyright law, this article is considered intellectual property, which includes a prohibition on copying and distributing it without consent.