Trading using fractals is one of the variants of the Price Action system, where the key element of the trading strategy is the use of chart patterns. The developer of the classic fractal indicator is Bill Williams, who described the breakout trading model in his book “Trading Chaos” in 1995. Later, the theory was further developed and supplemented. A reversal fractal and a trend continuation fractal were identified, and principles for the formation of a fractal signal were developed.
Fractal theory in technical analysis is controversial due to different approaches to the interpretation of candlestick formations, which are often far from the ideal pattern. This review will help you understand how to filter signals sent by fractal indicators, build levels based on fractals, and trade signals at the moment of breakout. You will also find some profitable fractal trading strategies.
The article covers the following subjects:
Major Takeaways
Topic | Key points |
Definition of fractals | A recurring pattern composed of 5 candlesticks, in which the central 3rd candle has a High higher than the two previous and two subsequent ones or a Low below the one of the previous two fractals and two subsequent lows. |
Types of fractal | Fractal up (“bearish”), fractal down (“bullish”). True and false fractals. The difference is in the opening/closing price between the first and last candlesticks. |
Reasons for the formation of a fractal | A fractal in Forex is an attempt by sellers or buyers to push the price in the desired direction, which fails. Due to a lack of volume or closed trades, the price rolls back. If the next fractal breaks out the level of the previous one, the price momentum supports the subsequent trend. |
Trading using fractals | Placing fractals at the same level allows traders to build resistance and support levels. Based on the fractal type, one can predict the further direction of price movement. Bill Williams also recommended using fractals with the Alligator indicator. |
Types of Fractal Trading Strategies | Breakout trend strategy, swing trading using fractals, and trading reversal patterns. |
Advantages and disadvantages of fractals | Advantages: fractals indicate potential pivot points and help build support, resistance levels, and trend lines. Disadvantages: they send quite many false signals. |
Fractal trading tips | Use fractals as an auxiliary tool in trading Forex or other markets. The fractal indicator works well with oscillators such as RSI or CCI and trend indicators. Confirm signals in longer timeframes. |
What Does The Fractal Pattern Look Like
Fractals are recurring patterns. A fractal is a combination of five candles in which the third candlestick always has a higher high (fractal up) or a lower low (fractal down) compared to the two candles before and the two candles after it. The figure below indicates the fractal candle by the number “3”.
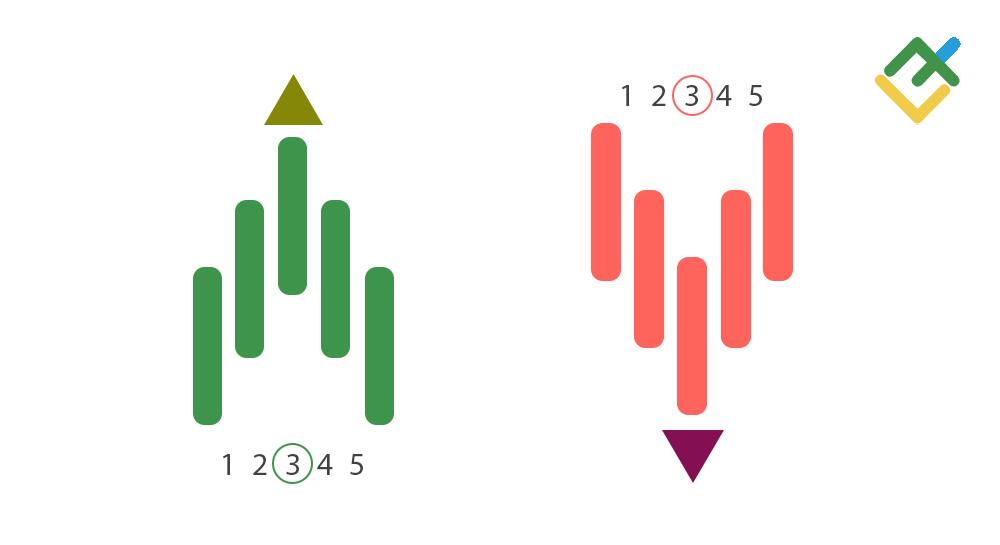
According to the fractal trading theory developed by the author of the fractal indicator, Bill Williams, the first type of the pattern with a fractal up is called a bearish fractal and is interpreted as a trend reversal down. The second V-shaped formation is a bullish fractal pattern, as it indicates a trend reversal up.
Bill Williams' theory was refined. The concept of true and false fractals was introduced, which determine the subsequent direction of the trend in fractal trading. In other words, a bearish fractal can indicate both upward and downward movement, depending on the truth or falsity of the pattern.
Important! Below is the author's personal opinion, which can be discussed in the comments.
In some sources, the concept of a bullish fractal is used for a V-shaped formation. In theory, it should indicate an upward price reversal, so it is bullish. But everything depends on the impulse of the candlesticks following the fractal. If they are short, the fractal is true; if they are long, the fractal is false. A true fractal indicates a continuation of the trend due to a small reversal impulse. Therefore, many sources use the terms “fractal up” and “fractal down”. A fractal down is bullish in theory, but a true fractal down confirms the continuation of the downtrend.
The fractal pattern is useful because it is easily recognized in the chart. It is most informative in a sideways trend when there are no sharp price jumps and no fundamental volatility. When the price tries to break out up or down, it forms extreme points. Based on their direction and the pattern type, it is possible to predict in which direction the price will break through. Accordingly, set stop losses based on the opposite fractal level.
Formation of A Fractal
The formation of a fractal in Forex begins when, of three consecutive candles, the last, third, turns out to be higher or lower than the previous two, and the fourth candle turns out to be lower/higher than the third, fractal. If the fourth candle closes above/below the third, then it becomes the fractal. The fractal formation is fully formed as soon as the two candlesticks follow the fractal close lower/higher.
Important moments:
There are not always five candlesticks. There may be three or seven. However, three candlesticks compared to five are considered a weak signal. Seven candlesticks are the other extreme. For one thing, the fractal signals will be very delayed since, after the fractal one, you need to wait for four more candlesticks. For another, the seventh candlestick may turn out to be the very breakout of the pattern at which you need to open a position. So, the optimal number of candlesticks in a bearish or bullish fractal pattern is five.
The pattern generates a more accurate fractal signal in longer timeframes, starting from H1 and higher. In shorter timeframes, price noise is often observed - random price movement in both directions under the pressure of the speculative capital of market makers, the panic of traders, and so on.
It is desirable that the fractal candlestick shows the same direction as the first two. For example, if the first two candles are ascending, the fractal candle should also be ascending.
An up fractal is true if the Low price of the last candlestick is higher than the Low price of the first candlestick. A down fractal is true if the High price of the most recent down fractal is lower than the first candle's high.
A true up fractal:
A false up fractal:
A true down fractal:
A false down fractal:
Fractals are constructed based on the highs and lows, not on the opening/closing price of the candle. The perfect formation of a fractal candlestick pattern in a chart is rare. Example:
In the first case, the fractal is formed clearly but with a nuance. The low of the middle candlestick is much lower than that of the candles on the right and left. But the fractal candlestick is ascending, while the ones preceding it are descending. The formation of a down fractal by an ascending candlestick is more likely a signal for a price reversal.
In the second case, the candlestick formation is not clearly formed. Firstly, the previous two candles are different, as are the next two. Secondly, the shadow of the fractal candle is only slightly higher than the shadows of the side candles. This pattern is ignored.
There also can occur non-standard fractal patterns in technical analysis. For instance, a fractal candlestick is both a high and a low in a candlestick pattern. This fractal pattern is ignored.
The second option is similar: a fractal candle is directed, for example, upward, and the next one turns out to be fractal downward. This is also a pattern of uncertainty that is not taken into account.
Interpreting and Using the Fractal Pattern
Fractals in a flat and in a trend are interpreted differently.
Flat
In sideways movement, Forex fractals help to form a flat channel and determine the direction of the breakout. The essence of fractal formation is as follows:
Buyers place orders, thereby pushing the price up. Three consecutive upward candlesticks are formed in the chart, and each subsequent one is higher than the previous one. The third candle is fractal.
Buyers are not confident in the market situation, so they are in a hurry to take profits and exit trades. The fourth and fifth candlesticks are descending.
Sellers go ahead. Now, a down fractal is formed. However, sellers are not sure that the downward movement will continue, so they close positions.
Several completed fractals up make up a resistance level, and several fractals down form a support level. When an asset is trading flat, a breakout of either of the levels means the trend is beginning.
Example of fractal trading:
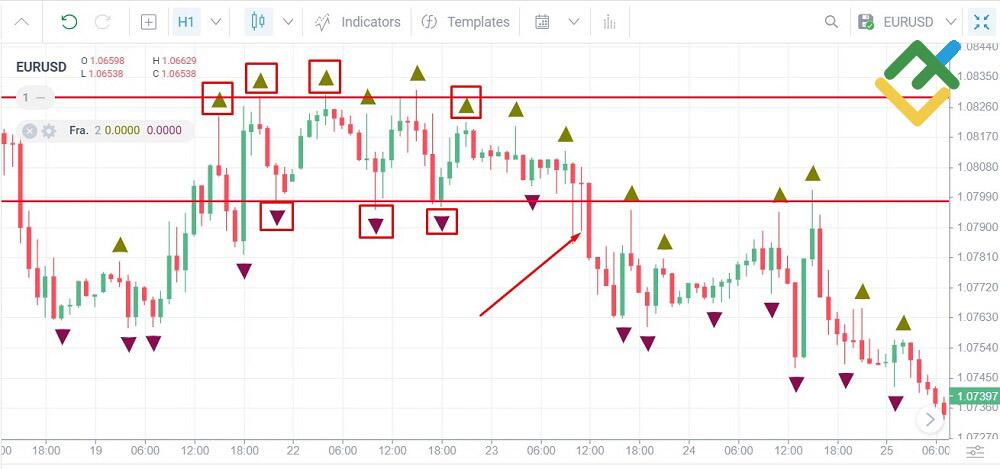
The Fractal indicator has drawn quite many arrows, most of which are not fractals. Relatively correct formation occurs in patterns whose fractals are highlighted in red boxes. Based on these Forex fractals, resistance and support levels can be constructed. Fractal patterns also form inside the channel, but they confirm the weakness of the price movement. Only when the support level is broken down could there be suggested the beginning of a trend. Stop loss is set at the resistance level.
Trend
In a trend, a fractal helps determine the continuation or reversal of the price movement. The appearance of a true fractal in a trend means a temporary correction with subsequent continuation of movement. The appearance of a false fractal implies a reversal in the direction opposite to the fractal.
A trend is confirmed when each subsequent fractal forms higher than the previous one for an uptrend and lower than the previous one for a downward trend. A reversal signal appears as soon as the trend changes in the opposite direction.
An example of a simple fractal trading strategy:
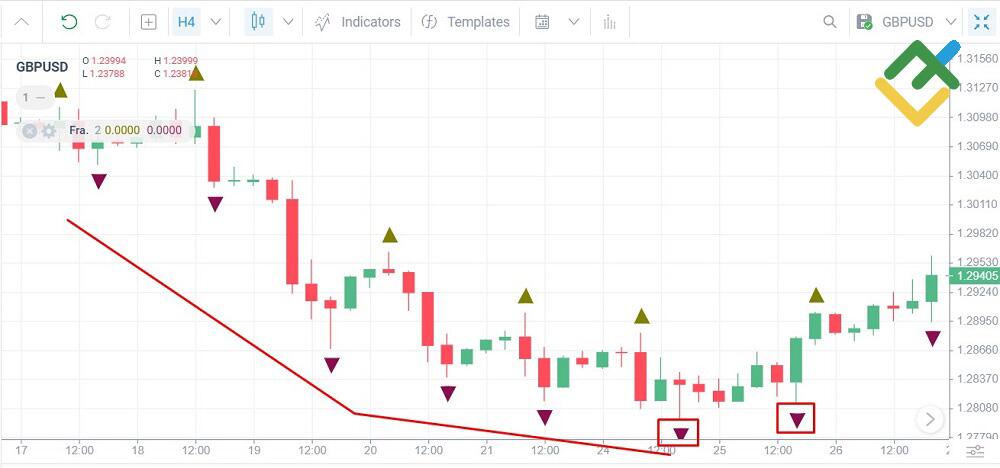
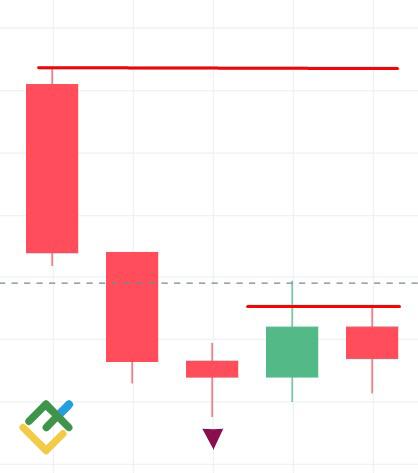
Each subsequent fractal is lower than the previous one. The last 7th fractal is above the sixth, indicating the downtrend's end. We are looking for a signal to open a long position.
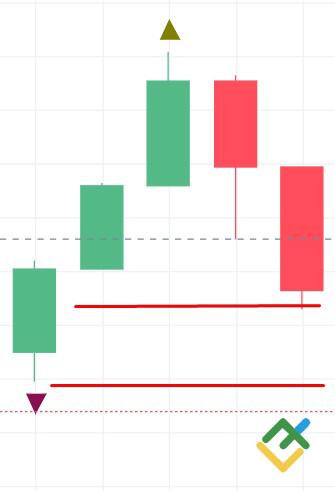
An example of a complex trading system using true and false fractals:
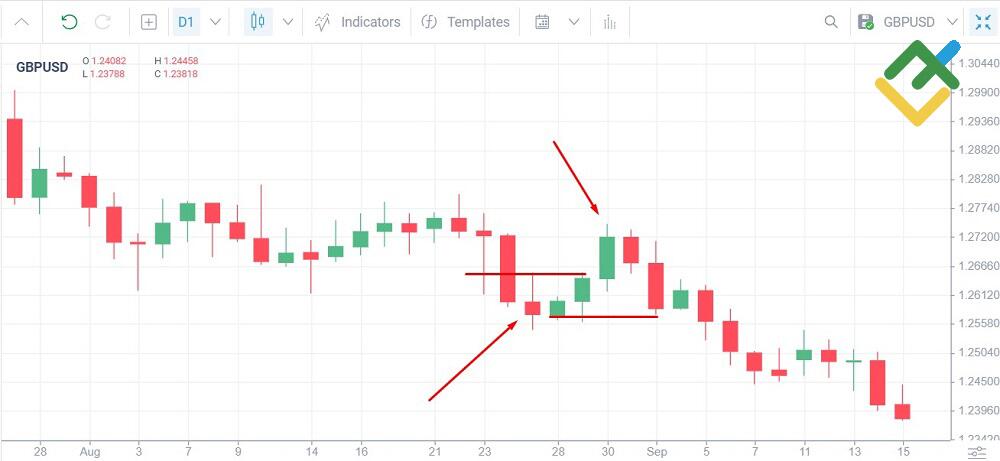
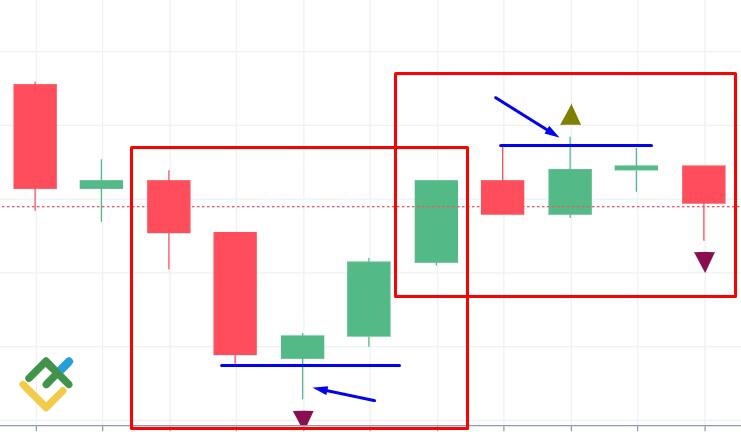
In a downward trend, a downward fractal is formed. It is a true fractal down because the next two green candles are below the first two candles of the pattern. An upward fractal is also formed during the correction. But the first candle's opening and the last's closing are almost at the same level. It is better to classify such a fractal as false since sellers were able to push the price to the level where buyers tried to seize the initiative. A true downward fractal indicates a continuation of the bearish movement; a false upward fractal confirms this signal.
If you do not want to spend time figuring out which fractal is true and which is false, there is another way to interpret fractals to enter trades in the trend.
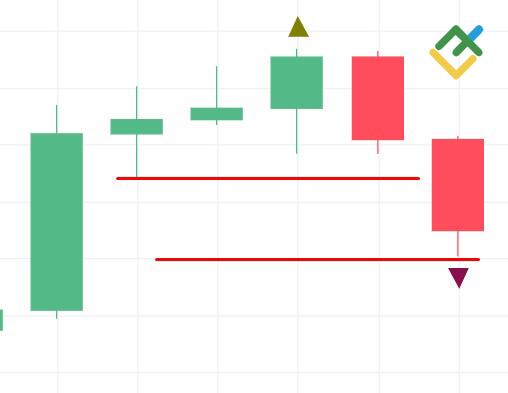
It looks as follows in the chart of the previous example:
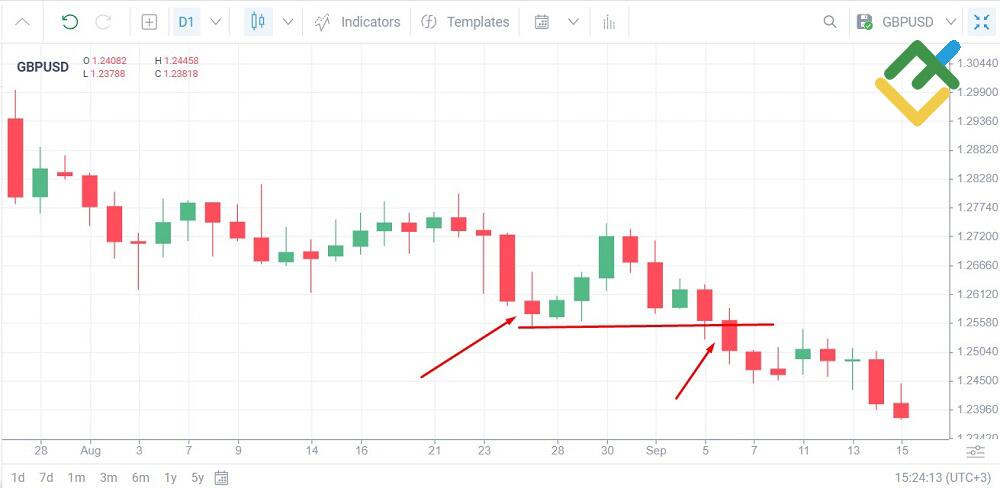
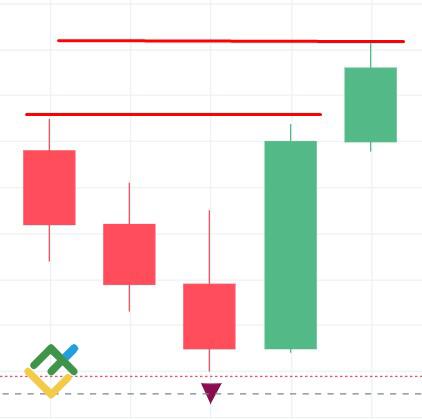
A down fractal forms (the first arrow); next, there is a correction and further price movement. The price breaks out the fractal level (the second level). Enter a trade after the breakout.
What is the Fractal Indicator?
Perfect fractals rarely occur in the chart, and side candlesticks relative to the central one can be located at different heights. Fractal patterns are usually difficult to spot, especially when you need to keep an eye on fundamentals or other charts. To make it easier to search for fractal patterns, the Fractal Indicator was developed by Bill Williams. The fractals indicator is built into the most popular trading platforms.
Essential facts about Fractal indicators:
The indicator automatically tracks the formation of fractals. In a candlestick chart, the indicator marks them with an up or down arrow. To open a long position, you need to focus on the up arrow; to open a short position, you need to look at the down arrow. This is one of the possible interpretations.
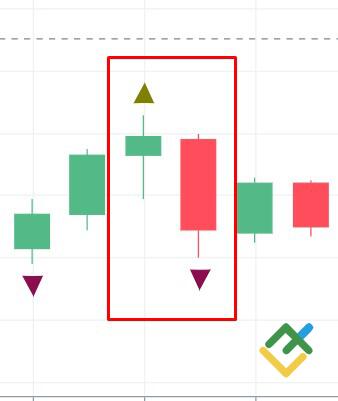
A fractal is a formation of five candles. Before deciding to enter a trade, you need to wait until the fifth candle in the formation closes. The arrow appears early to alert the trader to a possible signal. The indicator arrow will disappear if the fifth candle closes above/below the middle one.
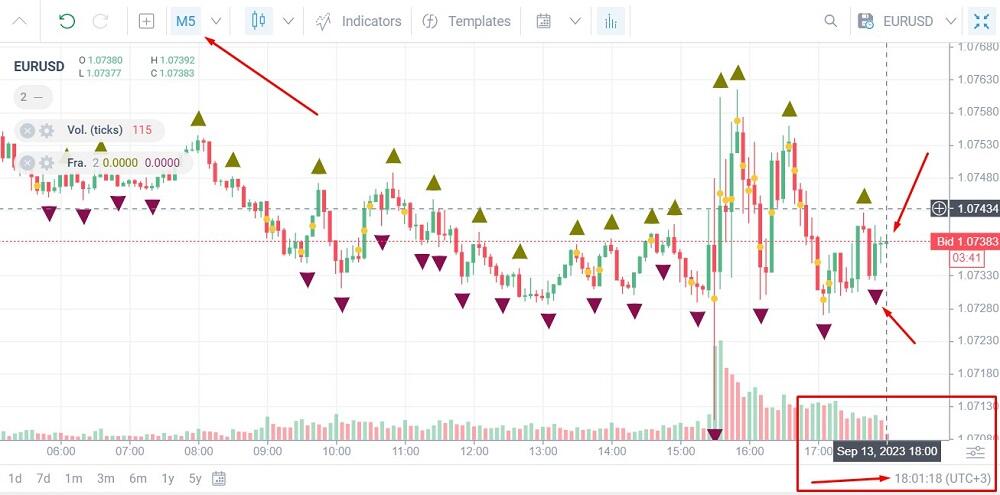
In the M5 timeframe, the fifth candle was completed at 18.00-18.05; the current time is 18.01. That is, the candlestick has not yet formed, but the indicator has already drawn an arrow down. It is necessary to consider that the fractal indicator is lagging, so there is no need to rush.
The advantage of the fractal indicator is that it visually shows a fractal candlestick when the pattern has not yet fully formed. That is, it works proactively, warning the trader. Fractal arrows formed at a fixed interval allow you to see resistance and support levels quickly.
The disadvantage of the fractal indicator is that it draws arrows in the presence of a single condition - the high/low of the middle candlestick. Such signal-strengthening moments as the closing of the body of a fractal candlestick above/below neighboring candles the coincidence of the direction of the fractal and previous candles are not taken into account by the indicator. Therefore, signals must be filtered.
Fractal Indicators Can Be Used to Determine the Market Direction
Fractal indicators help recognize patterns in different timeframes and market conditions. In the trading platform, fractals are marked with up and down arrows. The differences between the indicators are in their pattern recognition algorithm embedded in the code.
Examples of Fractal Indicators
Fractal indicators differ from each other in settings and additional filters. Let's look at some of the examples:
Fractals by Bill Williams. The indicator works according to a simplified algorithm: if there is an extreme exceeding the ones of the first two candles and one subsequent candle does not break through the extreme, the indicator draws an arrow before a pattern completes.
Fractal indicator combined with the ZigZag indicator. ZigZag draws trend lines along the most significant extremes; extremes are fractals. The Fractals ZigZag indicator gives rarer but more accurate trading signals compared to the classic indicator, eliminating false patterns.
Fine_Fractals_Alrts. Classic fractal indicator with sound alerts.
Fractal Lines. In addition to indicating fractal candles, the indicator draws horizontal resistance and support levels from the most significant fractals. The authors claim that levels and fractals are built without redrawing. This is partly a plus, but signals may be delayed.
MTF Fractals. The indicator searches for fractals simultaneously in several timeframes and displays information on the shorter one if there are matches. For example, a fractal will appear in H1 if there is also a fractal in the timeframes H4 and D1.
Using Fractals for Stop Loss Placement
There are two ways of stop loss placement using fractals:
1. When the market is trading flat. The stop loss is placed 2-3 pips from the opposite fractal when the main fractal level is broken out. The size of a stop loss depends on your risk appetite.
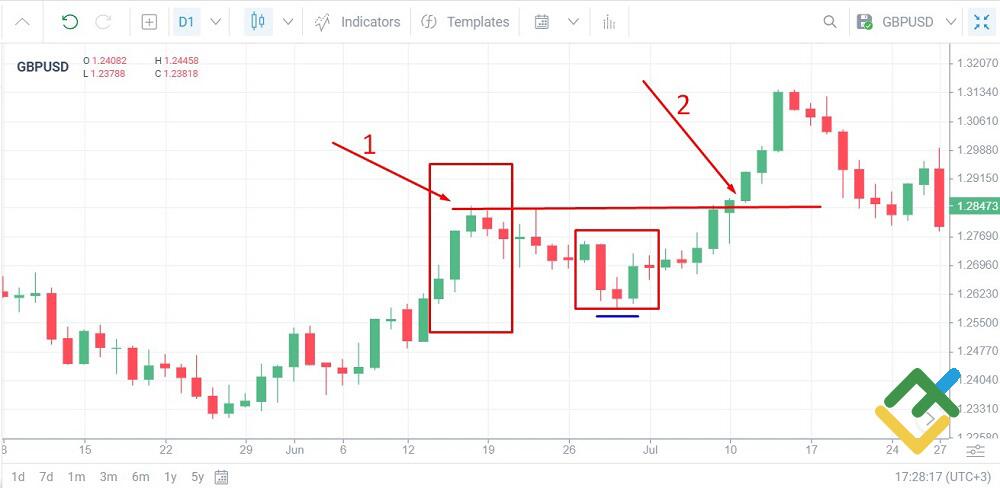
A clear fractal appears in an uptrend (1), referring to the true one. Since the next two candles are short and do not return to the level of the beginning of the fractal price pattern, the trend is expected to continue. At the low of the correction, a weak fractal pattern is formed (the first candle is upward, and the fifth is a doji). At the moment of the breakout of the fractal level, open a long position on the candlestick “2” and set a stop loss below the corrective fractal (at the level of the blue line).
2. When the market is trading flat. A trade is entered when the price breaks out one of the boundaries of the corridor indicated by fractals. It is allowed for the price to return to the corridor with a retest of the opposite border, so the stop loss is placed at a distance of 3-5 points from it.
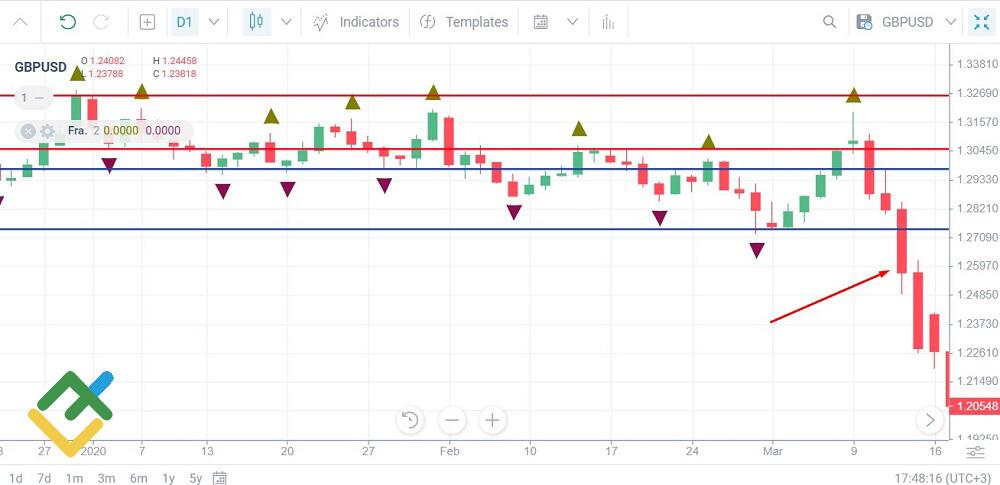
In a flat, the zone of the up fractal (the range between the red lines) and the zone of the down fractal (the range between the blue lines) are relatively clearly visible. A breakout of the support level downside (arrow) is a signal to open a short position. Stop loss can be placed either on the upper blue line or at the level of one of the red lines, depending on your investment objectives and the risk level you can accept. You should not risk the money that you cannot afford to lose.
Fractal Indicator Caution
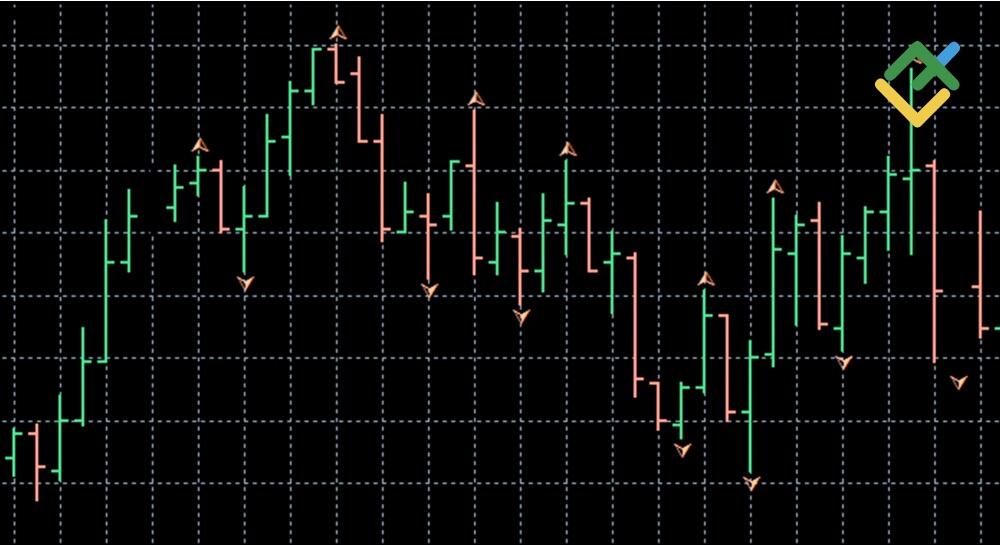
When you work with several charts and need to monitor the appearance of a fractal quickly, I recommend using the Fine_Fractals_Alert indicator.
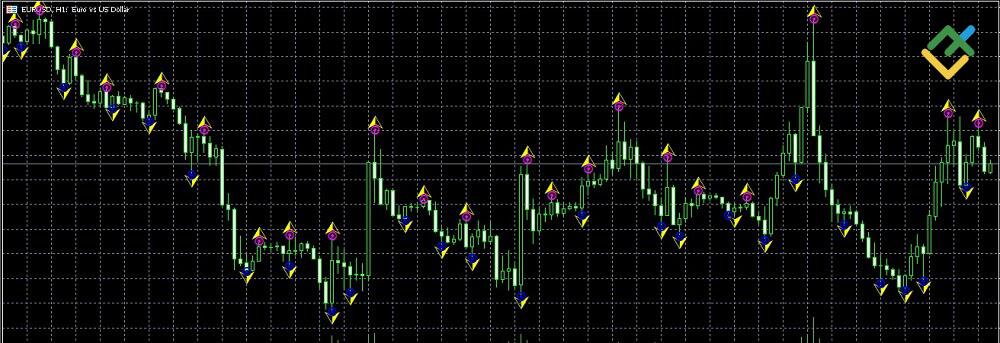
As you can see in the screenshot of the chart, this tool is identical to Bill Williams' fractal indicator. The main trading indicator is displayed as yellow arrows, and the Fine_Fractals_Alert indicator is shown as pink and blue circles that completely coincide with the arrows. Its advantage is a sound alert when a fractal appears.
Download the installation file for MT5. In the platform, click on the File/Open data directory and select the MQL/Indicators directory in the window that appears. Past the indicator installation file into the folder and restart the platform. The indicator will appear in the Insert/Indicators/Custom menu.
Trading using Flexible Fractals Channel
Most fractal indicators form only horizontal levels, which are built based on the accumulation of fractal points at one mark or according to other criteria. This is not entirely convenient, as an indicator draws too many lines on the chart. The solution is the Flexible Fractals Channel indicator.
The Flexible Fractals Channel indicator connects the most significant fractals, forming a flexible channel.
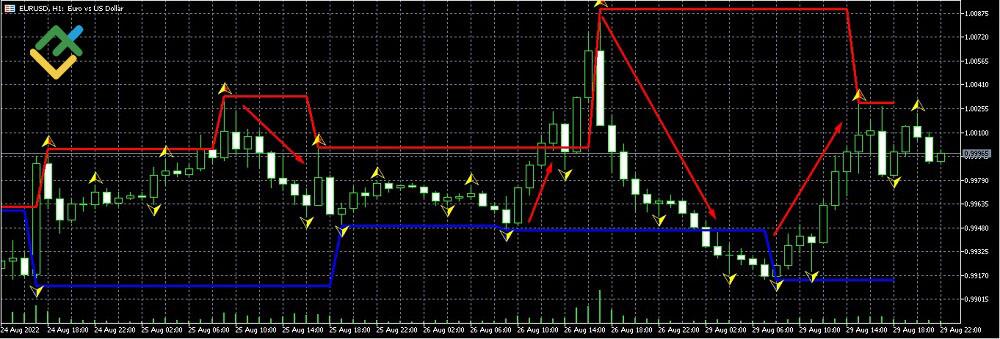
This indicator is superimposed on standard Bill Williams fractals in the screenshot above. You can see several moments:
Flexible Fractals Channel ignores most of the fractal candles, connecting only those that are as far away from the average price as possible.
The Bill Williams indicator is used to indicate points from which, upon a rebound, trades can be entered.
- The best trading strategy is trading inside the channel in the H1-D1 timeframes. Red arrows indicate strong trend movements at the moment of rebound from the channel border.
What is Fractal Trading?
In trading theory, there are two trading strategies using a fractal: single-timeframe trading and multi-timeframe trading. The first tactic involves two trading strategies: opening a position when the price exits a flat and swing trading - entering a trade when it breaks out along the trend of the previous fractal. The second trading strategy involves searching for fractals in a longer timeframe and searching for a fractal signal in a shorter one.
Fractal Reversal Patterns
The idea of this trading strategy suggests filtering the fractal indicator signals using a ZIgZag indicator. ZigZag is an indicator that connects the most significant highs and lows with straight lines, forming a broken line. It ignores minor movements that the fractal indicator notes. The coincidence of the high or low indicated by ZigZag and Fractals can be considered a signal.
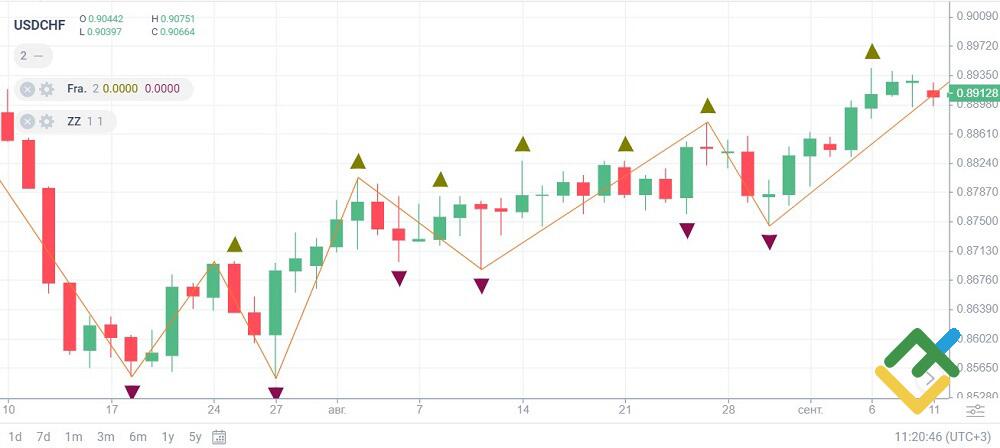
The chart shows that the ZigZag helps filter out at least 50% of the Fractals signals, which mostly only confuse the trader. It is necessary to assess the closeness of the formation to the ideal pattern and determine whether a fractal is true or false only at those points where there are coincidences of the signals of both indicators.
This combination is not the basis of a trading strategy — it is just another signal-confirming tool. The idea works well on an intraday trend in swing trading. It can also be used in the D1 timeframe, making money on short price movements in both directions. The target profits will depend on your investment objectives.
Fractal: Multiple Time Frame Analysis
The classic fractal indicator by Bill Williams has a significant drawback — it marks all candlesticks that at least somehow correspond to the conditions of the highs and lows of the fractal candle. As a result, the chart shows candlestick formations that are very far from the classical fractal formation. One of the options for filtering false signals is to analyze the price chart in longer time frames.
Analysis algorithm
The sequence of actions during analysis is as follows:
Search for a trend in a longer timeframe. For example, a fractal should appear in the interval D1, the formation of which allows us to make an unambiguous conclusion about the direction of price movement.
Search for an entry point in a shorter timeframe. In the H4 chart, look for the formation of a fractal pattern. If there is a coincidence in both timeframes and both signals show the same direction, look for an entry point.
You can automate the search for signals using the i-MTF Fractals indicator. In the current timeframe, it draws fractal points up and down with the addition of horizontal levels. Visually, it looks like this:
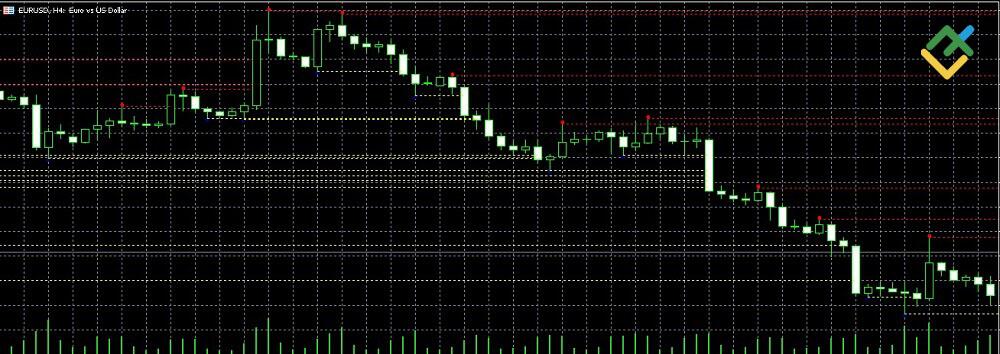
Fractal points are constructed according to the classical principle of defining a candlestick pattern; they completely coincide with the Bill Williams indicator. Horizontal lines correspond to strong resistance and support levels that form in the current and longer timeframes. You can reduce the scaling to locate the area where levels accumulate visually. The accumulation of horizontal lines will determine the supply and demand zones, which can be used to build breakout trading strategies.
How to Trade With Fractal Indicator
Fractal trading strategy tips for beginners:
Filter the fractal indicator signals. Distinguish true from false fractals, analyze longer timeframes, and filter signals with trend indicators and oscillators. Bill Williams advised using the fractal indicator to confirm signals generated by the Alligator indicator in trend strategies.
A Bullish fractal with a downward fractal candlestick, if true, can indicate a continuation of the downward trend. If false, it indicates an upward price reversal. For bearish fractals, the situation is mirrored. This paradox (a false bullish fractal indicates the beginning of an upward trend) arose when Bill Williams’ fractal theory was further developed.
When the market is trading flat, use the fractals indicator to search for strong support and resistance levels whose breakout will signal a trade entry.
When the market is trending, monitor the levels of fractals. In an uptrend, follow the upward fractals; on a downtrend, follow the downward fractals. If the last fractal in an uptrend is lower than the previous one or in a downtrend is higher than the previous one, this is a signal for a trend reversal.
Combine the fractals indicator with other technical indicators. For example, the appearance of a fractal with an oscillator in the overbought or oversold zone may indicate a potential trend reversal. Conversely, a fractal that coincides with a trend indicator signal can indicate a temporary correction and continuation of the trend.
Fractal Indicator Advantages and Disadvantages
Fractal advantages:
You can use fractals to build support and resistance levels. Fractals quite well define sideways trends.
Fractal patterns send early entry signals. A trade is entered when the zone of fractals accumulation is broken out by the price.
fractals indicator indicates levels for Stop loss placement.
- fractals indicator helps define potential price pivot points.
Fractal disadvantages:
Fractals indicator sends quite many false signals and can’t be used as a primary tool for market analysis. There is an opinion that it is better to search for fractals visually without using indicators since indicators do not take into account the nuances and signal a fractal where there are not any.
They are hardly efficient in short timeframes due to the market noise.
Indicators send signals a bit too late, as the fractal pattern is completed only when the fifth candlestick closes.
The truth or falsity of the pattern. The more the formed pattern differs from the standard formation, the greater the likelihood that the extreme will be false.
Fractals indicator is more of an oscillatory tool that confirms other trend indicators' signals.
Conclusion
Fractals are candlestick price patterns in which the central candlestick has the highest high (up fractal) or the lowest low (down fractal). A complete pattern often consists of five candles, less often - of seven. You can use fractals in any financial markets: stocks, commodities, trading CFDs. You can use fractals to trade foreign exchange markets.
There are true fractals and false ones. The difference is in the high/low prices of the last candlestick compared to the first.
In a trend, a true fractal means a continuation of the trend, and a false fractal means a trend reversal. A position is opened when the current candlestick breaks the level of the previous fractal.
In a flat, fractals form resistance and support levels. When the price breaks through the fractal accumulation zone, a position is opened in the direction of a new trend. Stop loss is placed 2-3 pips below the low/above the high of the opposite fractal.
- Fractals indicator is a signal-confirming tool. Fractal patterns work efficiently in conjunction with the Alligator indicator and the reversal indicators. You can apply fractals in addition to Fibonacci ratios, price action patterns, and other technical indicators.
Many sources criticize the fractals indicator for generating false signals. But there are no perfect indicators. The fractal indicator is a good technical tool for a professional trader that can successfully complement trading systems. However, be careful and do not trust any trading strategy as investment advice. One should always observe money management rules to multiply the initial investment and protect retail investor accounts from losing money rapidly.
Fractal Trading FAQs
Fractal indicators are useful in trading. You can use fractals in long-term timeframes as an additional tool for identifying key support and resistance levels, the breakout of which means that a new trend is likely to start. Fractal patterns can also be used to calculate stop loss levels.
When the market is trading flat, the fractals indicator is used to build a channel upon the breakout of which the trade is entered. In an uptrend, each higher fractal indicates a continuation of the trend. If the last fractal is lower than the previous one, it is a signal of a possible end to the uptrend. For a downward trend, the situation is mirrored.
Fractals indicator is often used in intraday swing trading and trend trading strategies to search for trend pivot points and signals when a flat ends.
You can use fractals in the stock market just as well as in foreign exchange trading. The fractals indicator in trading stocks monitors potential breakout levels, builds key levels, and defines the levels for stop-loss placement.
The content of this article reflects the author’s opinion and does not necessarily reflect the official position of LiteFinance broker. The material published on this page is provided for informational purposes only and should not be considered as the provision of investment advice for the purposes of Directive 2014/65/EU.
According to copyright law, this article is considered intellectual property, which includes a prohibition on copying and distributing it without consent.